杀本鹑
@leokun
第一身份:一只傻鸟,笨,蠢!第二身份:缠论交易者。
Following
Followers
Liked
Shared
See original
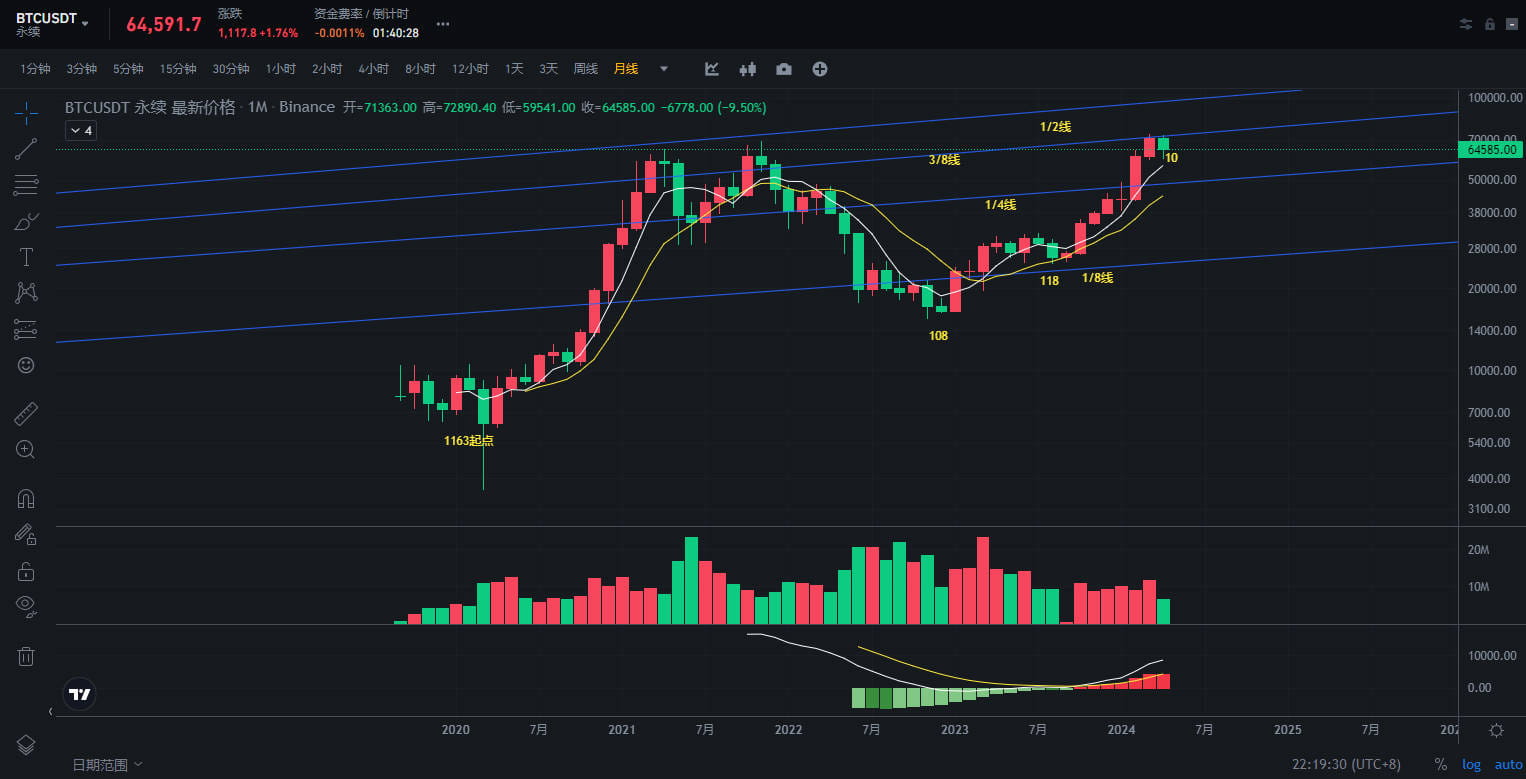
The current trend was blocked and fluctuated for two months at the 3/8 line of circular motion mentioned above. This line is also the position where the bull market ended in 2021. The first time it encountered this line in 2021, Bitcoin pulled back 50%. It failed to hit this line again, ending the bull market. The current trend encountered this line again.
In addition to the strong pressure of 3/8, another strong pressure is that the monthly consolidation divergence section has not been broken. If the divergence is established, the adjustment will be super large, and it will be a large correction of at least another 50% drop in the intermediate level. Before each halving, there will be a large correction in the third section of the large center. Whether this year's halving will be a sword-seeking sword in the third section of the center is still unknown.
The sword-seeking sword in the third section of the center, the correction in 2021 was to the 1/4 line position. If it is corrected this time, it may also return to the 1/4 line position, near 49,000. Can the sword be sought?
From the circular motion, it is obvious that Bitcoin needs to break through and stand firm at $100,000 (that is, the 1/2 position) to start a technically unresistance bull market.
See original
In this case, don't rush to buy the dip, so what if you make less money? ! The monthly line of Big Pie is not going well. 59,000 is a critical position. If this point is not quickly pulled back after falling, a larger level of correction will be formed. 59,000 is the bottom of the monthly line. Looking at the divergence pattern of macd on the monthly line, it is a bit scary! To say something that may be alarmist, if Big Pie's decline does not stop, if the 4-hour divergence is not established, the mid-term correction bear market will begin. Hurry up and pull it up, Brother Bing, the copycat was hard last night, why are you scared!
See original
Bitcoin hit a new low last night, but many copycats did not. The subsequent rebound strength of copycats was far ahead of Bitcoin. This signal has a bit of a "rebellion" meaning. Bitcoin is in a divergence phase in the 4-hour period, and it does not mean to be completed. Be careful of copycats' fraud!
See original
This chart shows the mining cost of each bitcoin for bitcoin miners. It can be seen that although bitcoin has risen from 15k, miners did not start to make a profit until the ETF was passed, which means that the price of bitcoin has doubled before. Miners are in the process of recovering their investment. How did miners survive this situation for more than half a year? Finally, they have recovered their investment. Should they cash out some funds for turnover?
The current situation is that miners are basically not profitable. After a week, the computing power will increase, the reward will be halved, and the cost will double directly. Now the cost of each bitcoin is around 50k, and the cost will be 100k after a week, but the price is still 60k.
Conclusion: Bitcoin is now 60% off, a bargain!

See original
If you buy spot A with 1,000 yuan and borrow 500 yuan to buy more, the leverage is 1.5 times, which means 1/1.5=0.66, that is, a 66% drop will cause a liquidation. Do you think this configuration is safe? Is the leverage very low?
Unsafe! One of the positions was only 18% away from 66% yesterday, which is really exciting!
Unsafe! One of the positions was only 18% away from 66% yesterday, which is really exciting!

See original
The United States will not be able to pay back its debts starting next year, with a national debt of 37 trillion US dollars and federal liabilities of 3.5 trillion US dollars. The US government is insolvent. Facing bankruptcy, the US government is short of dollars!
What do you think the US government will do? What does it have to do with Bitcoin? What does it have to do with CZ? What does it have to do with Binance?
You guess it's a coincidence, maybe! Think about this world, who is telling the truth!
What do you think the US government will do? What does it have to do with Bitcoin? What does it have to do with CZ? What does it have to do with Binance?
You guess it's a coincidence, maybe! Think about this world, who is telling the truth!
See original
Who can explain the logic that Shanzhai bull market will definitely explode in this bull market? Based on the experience of previous bull markets, Shanzhai bull market will have a bull market, but experience is not necessarily the truth. Just because it has been right in the past does not mean it will be right in the future. Of course, it may not be wrong. Who can explain the logic of Shanzhai bull market and whether there are Shanzhai bulls in this bull market? This is the most critical issue at present. A group of people shouted Shanzhai bulls and took the opportunity to buy at the bottom. Why don’t they talk about the logic of Shanzhai bulls? Study it yourself. I don’t want to listen to these people shouting without logic!
Maybe they really treat leeks as leeks. Leeks don’t need logic, they just need to rush without thinking! Maybe they themselves don’t understand the logic!
Study it yourself and be responsible for your own money!
Maybe they really treat leeks as leeks. Leeks don’t need logic, they just need to rush without thinking! Maybe they themselves don’t understand the logic!
Study it yourself and be responsible for your own money!
See original
Chaos Past 6: Central Shock
Each of you has your own inherent pattern, and the pattern can only be changed if you awaken yourself. Behind me are thousands of traders, whose consciousness together constitutes my collective consciousness, and I am also constantly patterned and reincarnated. What is my pattern? It is the center. It can be said that "I am the center and the center is me". Without the center, of course there is no oscillation, no oscillation deviation, and no end to the oscillation.
After the rebound, a new 5F center is formed. There are many ways to decompose the 5F center. You can start from 99 or 6. Here I will use a more comfortable way to divide it. The three-segment sub-level structure of the center: 6-15, 15-18 and 18-21. The first segment is an a+B+c structure as a whole. 14 can be seen as the three sells of the 1F center of 912. The second and third segments are both ABC consolidation divergence structures. These are relatively obvious operation opportunities and are typical interval sets. The interval of the center, that is, the two dotted lines, forms the real resistance and support positions.
After the rebound, a new 5F center is formed. There are many ways to decompose the 5F center. You can start from 99 or 6. Here I will use a more comfortable way to divide it. The three-segment sub-level structure of the center: 6-15, 15-18 and 18-21. The first segment is an a+B+c structure as a whole. 14 can be seen as the three sells of the 1F center of 912. The second and third segments are both ABC consolidation divergence structures. These are relatively obvious operation opportunities and are typical interval sets. The interval of the center, that is, the two dotted lines, forms the real resistance and support positions.

See original
Chaos Past 5: True Resistance and True Support
After the US data came out, I went all the way down to the 4-hour annual line. Observing this red line, I have been supported by the red annual line three times. So will I be supported again this time? If you don't look at my internal structure, but only look at the past trends, then the operator will draw a conclusion based on past experience or other data: I will continue to fall, or I will be supported again. But the basis of this conclusion is not based on my current structure, but factors outside of me. Even if the operator is right, it cannot prove that his reason is right. Here I will tell you why the 4-hour annual line supports me again and opens a new oscillation segment. Look at the internal structure of my decline from 72888 this time. This is the core, and the others are auxiliary.

See original
Chaos Past 4: Oscillation Shift
I bought a new computer and I will make up for yesterday's trend story. This article is very important. If you understand it, you can open a position in advance at the end of the shock. The shock deviation is the intermediate state between maintaining the shock and ending the shock. The movement of a center, after it is formed, begins to enter the process of maintaining the shock, shock deviation, and shock end. What is shock deviation? Draw a schematic diagram:
The three red lines, ZD and ZG, are the intervals of the central oscillation, the low point and the high point. The center position ZM of the two lines is the middle value of the oscillation. After the central axis is formed, there are 5 oscillation segments, AB, BC, CD, DE and EF. Each oscillation segment also has a center position (circle position). Then compare the distance (offset) between the center position of each segment and MD. The farther the distance from ZM is, the greater the possibility of the end of the oscillation. Of course, the real end depends on the third type of buying and selling point of the central axis, but more often, the position can be opened at the farthest section of the oscillation offset. This is the oscillation offset, the key indicator of the end of the central oscillation. Now let's go back to yesterday's technical analysis. Let me explain that the following analysis is told in the first person of "I". This "I" is not the "trend" itself, because the trend is alive and has language. It tells the operator "what I am doing now" all the time.
The three red lines, ZD and ZG, are the intervals of the central oscillation, the low point and the high point. The center position ZM of the two lines is the middle value of the oscillation. After the central axis is formed, there are 5 oscillation segments, AB, BC, CD, DE and EF. Each oscillation segment also has a center position (circle position). Then compare the distance (offset) between the center position of each segment and MD. The farther the distance from ZM is, the greater the possibility of the end of the oscillation. Of course, the real end depends on the third type of buying and selling point of the central axis, but more often, the position can be opened at the farthest section of the oscillation offset. This is the oscillation offset, the key indicator of the end of the central oscillation. Now let's go back to yesterday's technical analysis. Let me explain that the following analysis is told in the first person of "I". This "I" is not the "trend" itself, because the trend is alive and has language. It tells the operator "what I am doing now" all the time.

See original
My computer is broken, I took it to be repaired, I can only post a long article tomorrow, I can't post the chaotic past today. It's early in the morning in the United States, yesterday morning there was a big positive line, this morning there was a big negative line, what's going on? I'm so shocked all day long! The owner of the cottage, lie down and sleep!
See original
This time, the oscillation section returned to the 4-hour annual line support position. Although 5F entered the divergence section, the secondary center that touched and left the 5F center was not formed. The force was relatively large. In addition, there was an expectation of a sharp drop before the halving. Can the annual line hold up?
Tonight, are the stars in the sky still bright?
Tonight, are the stars in the sky still bright?
See original
Tomorrow's chaos story will talk about how the news in the market is digested by the trend and reflected on the trend chart, and it is digested and reflected in advance, that is, the trend gives the operator enough time to intervene. If the operator understands this key point, he can clearly see how the shock ends, that is, the position of opening a position. At the same time, he will also deeply realize that no matter what the news is, it will be digested and reflected in advance by the trend, which means that the operator can observe the trend wholeheartedly without having to take into account various news, including black swans.