杀本鹑
@leokun
第一身份:一只傻鸟,笨,蠢!第二身份:缠论交易者。
Following
Followers
Liked
Shared
See original
The US dollar index started to rise after the 4-hour divergence on the 17th. There is no sign of ending at present, but it has touched the pressure line. It is better not to continue to rise, otherwise the rise of the big cake will be like this! The highest point of the big cake touched the 1/4 line, and it was beaten down again after the divergence. If there is a big market, the goal is obviously to stand firm on the 1/4 line. Otherwise, the best result is to continue to fluctuate for a few weeks, and the worst result is to end the fluctuation and return to the 1/8 line!
See original
Reminder: Don't chase high prices.
The US dollar index suddenly plummeted in one hour, and the corresponding Bitcoin suddenly rose. However, the US dollar index is a 4-hour consolidation divergence, and it is a range trap. It will rise later, and the corresponding Bitcoin will fall.
The US dollar index suddenly plummeted in one hour, and the corresponding Bitcoin suddenly rose. However, the US dollar index is a 4-hour consolidation divergence, and it is a range trap. It will rise later, and the corresponding Bitcoin will fall.
See original
How is a trend of a certain level completed? There are four stages in total, and the trend ends after the four stages are completed.
Step 1: The trend must be perfect. This trend must form the center of this level, that is, the trend must be perfect. The so-called perfection is that the center of this level is formed after the sub-level trend is completed.
Step 2: No trend, no divergence. After the formation of the big center of this level, a trend must be formed. Without a trend, there is no divergence.
Step 3: Divergence. Distinguish between consolidation divergence and trend divergence. Divergence is formed by trend, and the consolidation structure may not be completed, so you must wait until the trend appears.
Step 4: Range set. The trend of this level is the divergence segment or oscillation segment of the high-level trend. Under the support of the high level, this level ends. In addition, if it is not a range set or a high-level oscillation segment, the trend of this level is a second-level buying and selling point, that is, there is a high-level first-level buying and selling point in front, such as this turning point.
The above four stages are indispensable, otherwise the operation will be uncertain. As for the central oscillation, it is also operated on the premise of knowing clearly whether the current trend is rising or falling. The difficulty lies in the turning point of the trend. If you treat the turning point as a oscillation section, you will either miss the opportunity or be thrown down. If you follow the above four steps, you can greatly improve the accuracy.
See original
After the ETF is approved, Bitcoin will be priced in US dollars and officially become a US dollar-denominated asset. The US dollar index is directly related to the trend of Bitcoin, that is, when the US dollar index rises, Bitcoin will fall, and vice versa. When Bitcoin rises or falls, we must refer to the index trend. Now the 4-hour rise of the index has not ended, Bitcoin will continue to fall in the 4-hour period, but the extent of the decline is uncertain.
See original
Many people are bullish based on how much the ETF has bought or sold. This is a serious mistake. As the world's manager, multinational capital such as BlackRock does not even count ETF as a jelly bean on its menu. ETF is just a reason for capital to operate the big pie in compliance. BlackRock does not care about the management fees. What does the selling and buying of retail investors have to do with BlackRock? !
The fundamentals of the big pie have no direct relationship with ETFs. The fundamentals of the big pie are one of the battlefields in the international financial war! So don't consider the purchase cost of the ETF, or even the cost of the miners, as the fundamentals. Multinational capital has gone to great lengths to make ETFs compliant. Don't really think it is to earn management fees? !
The fundamentals of the big pie have no direct relationship with ETFs. The fundamentals of the big pie are one of the battlefields in the international financial war! So don't consider the purchase cost of the ETF, or even the cost of the miners, as the fundamentals. Multinational capital has gone to great lengths to make ETFs compliant. Don't really think it is to earn management fees? !
See original
The two supports of the big cake, the signs of 8-hour consolidation divergence, and the half-year line on the 12-hour line, the current 15-minute center is grinding this half-year line.
Note: This wave of falling market may be super large, and the profit and loss ratio is very high. So open a short position at the third perfect position of the current center (see the 15-minute line), and set the perfect position, that is, the opening position, as the stop loss position. Of course, in order to avoid the judgment of the third perfect position of the center in advance, the stop loss can be raised.
Every time you encounter a new center later, add positions at the perfect position. However, the premise of this operation is that the above two supports are not supported. If they are supported, the daily line will continue to fluctuate. If they are not held, there will be no resistance when they come down. All the way down is the 1/4 line of 49k, and the 1/8 line around 27k, completing the halving before the big bull market to form a super-large center at the monthly level!
See original
Today is the last day of April. The K of this month has been pulled down again. The monthly line fell below 59112, and the monthly line top pattern was formed. What is more dangerous is that the monthly MACD column shortened again! If it cannot be pulled up in May, that is, if the MACD column does not continue to increase, it is likely to be a desperate move. If the 38th parallel is lost, then we will face the 1/4 line. The position of this line in May is 49163
that is, 1163+1/4*1500*128=49163
that is, 1163+1/4*1500*128=49163
See original
From the market, the bulls want to leave the shock zone urgently, but the bears slap them down. The bears are slightly better at present, but only slightly better, because the bulls are still stronger, and the bears need to work harder to smash down. The short-term continues to linger at 64k. If the area around 64k cannot be pulled up, be careful of turning into an intermediate callback, and the 38 line mentioned above will be completely lost. The result will be in the next two days, maybe today.
See original
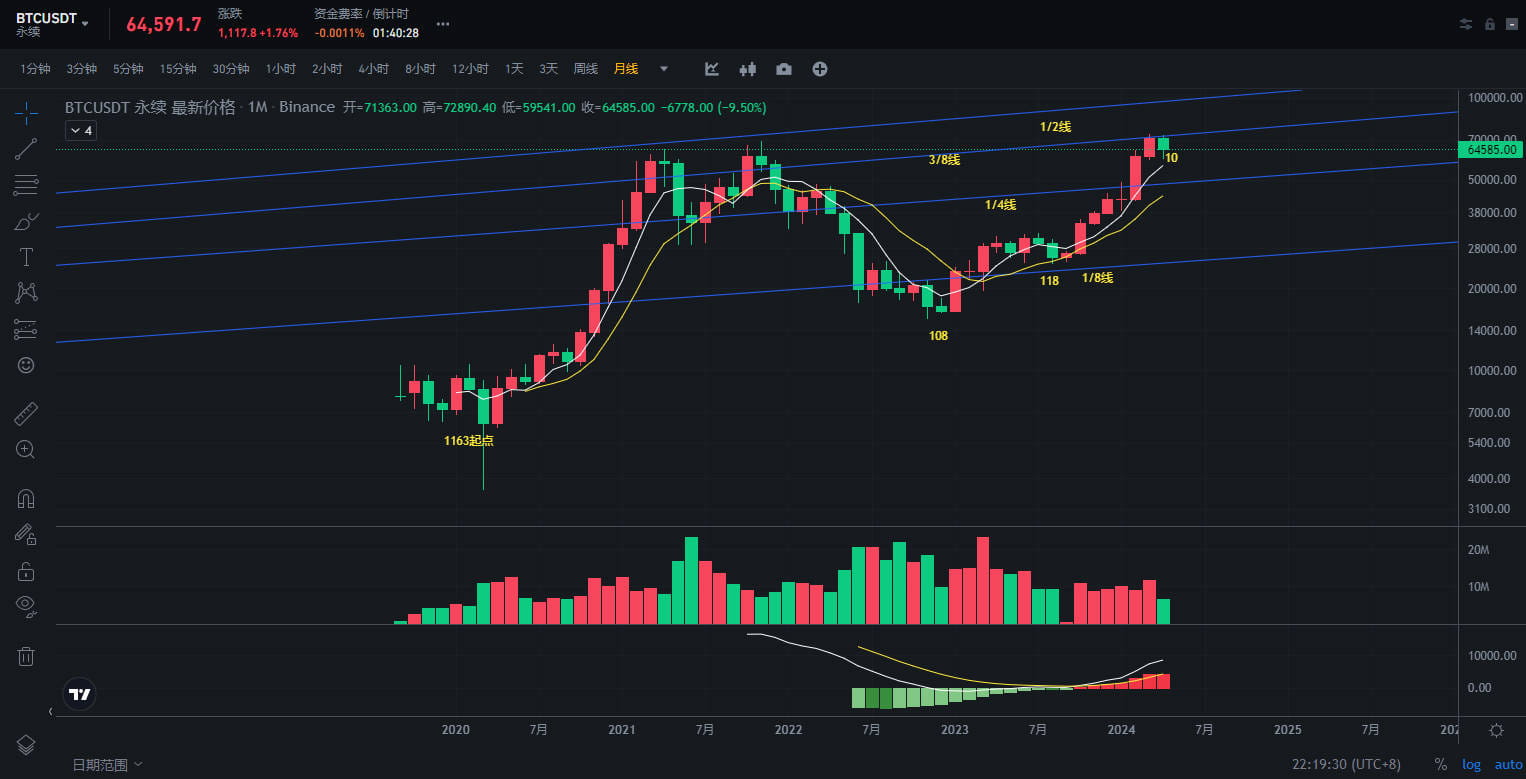
The current trend was blocked and fluctuated for two months at the 3/8 line of circular motion mentioned above. This line is also the position where the bull market ended in 2021. The first time it encountered this line in 2021, Bitcoin pulled back 50%. It failed to hit this line again, ending the bull market. The current trend encountered this line again.
In addition to the strong pressure of 3/8, another strong pressure is that the monthly consolidation divergence section has not been broken. If the divergence is established, the adjustment will be super large, and it will be a large correction of at least another 50% drop in the intermediate level. Before each halving, there will be a large correction in the third section of the large center. Whether this year's halving will be a sword-seeking sword in the third section of the center is still unknown.
The sword-seeking sword in the third section of the center, the correction in 2021 was to the 1/4 line position. If it is corrected this time, it may also return to the 1/4 line position, near 49,000. Can the sword be sought?
From the circular motion, it is obvious that Bitcoin needs to break through and stand firm at $100,000 (that is, the 1/2 position) to start a technically unresistance bull market.
See original
In this case, don't rush to buy the dip, so what if you make less money? ! The monthly line of Big Pie is not going well. 59,000 is a critical position. If this point is not quickly pulled back after falling, a larger level of correction will be formed. 59,000 is the bottom of the monthly line. Looking at the divergence pattern of macd on the monthly line, it is a bit scary! To say something that may be alarmist, if Big Pie's decline does not stop, if the 4-hour divergence is not established, the mid-term correction bear market will begin. Hurry up and pull it up, Brother Bing, the copycat was hard last night, why are you scared!
See original
Bitcoin hit a new low last night, but many copycats did not. The subsequent rebound strength of copycats was far ahead of Bitcoin. This signal has a bit of a "rebellion" meaning. Bitcoin is in a divergence phase in the 4-hour period, and it does not mean to be completed. Be careful of copycats' fraud!
Explore the lastest crypto news
⚡️ Be a part of the latests discussions in crypto
💬 Interact with your favorite creators
👍 Enjoy content that interests you
Email / Phone number
Trending Topics
CryptoPCEWatch
1.9M views
1,347 Posts
Will Bitcoin's $60K Support Hold? Key Factors Driving BTC Price Action This Week
Binance News
11 Likes
1.3k views
MtGoxJulyRepayments
1.7M views
973 Posts
CryptoTradingGuide
6.2M views
3,828 Posts


