
Hello everyone, I am your cat. I was live too late yesterday and got up late today. I wonder what plans you have for the National Day holiday.
Written in front:
1. I am not a teacher, so don't have too high expectations. I am just a leek, really just a leek, and my level is actually very limited, but I am still willing to share what I know, although it may not be right in many cases. So I hope you can be more tolerant when I am wrong, and try not to abuse me, thank you everyone.
2. We must have oversold last night. Normally, the correction should not be so fast. Here we can only understand that the news caused a short-term panic. When the market is rising, all the news is good, and the bad news can be ignored. When the market is about to correct, bad news will emerge in an endless stream. This is the usual practice of the main players and institutions.
3. Don't panic too much, a pullback is a normal market demand, and in October, just like the previous months, there will be another peak. In other words, there will be a pullback-rise-pullback every 30 to 45 days, which is a normal market operation rule. If you are too lazy to move the spot, you can patiently wait for it to pull back, but you should summarize the reasons for chasing highs and being trapped this time, and don't make this mistake again next time.
4. The currency circle is difficult to play, really difficult to play. The main force and institutions will constantly throw "smoke bombs" or "intervene in the normal market", making it go out of many trends that you cannot understand, or trends that you can't think of at the time. Guessing the top and buying the bottom on the left is a routine action. When the price runs and approaches the expected top, it will start to go short with a stop loss at that time. At the cost of a small stop loss (0.2%~0.5%), try to establish a short position at the top of the mountain. This is when the left side is constantly swept. If there is no intervened market, basically it will be swept 1~2 times to establish an empty position on the top of the mountain. However, when it is intervened, such as this period, when it deviates for more than 10 consecutive days, this process will be extremely painful. You will watch yourself being swept and lost, and the expected top value is constantly being refreshed. Therefore, don't envy the rate of return on the left, but also see the risks on the left. If you still use high leverage (as long as you have the habit of using high leverage, you can't do the left side, because you can't afford the loss), then it is recommended to find a few teachers on the right side to learn, such as @缠中圣手 @诗魂 @行舟 @加密财经 . Both @交易员张张子 and I are on the left side. Our method can only use low leverage + strict stop loss, and the winning rate is not good, especially when the market is about to change. If you think it's troublesome and hope to buy some spot and not move it to get a profit, then look at @Crypto-爱币斯坦 more. Fundamental analysis is indeed incomparable to technical flow. Teacher Ai has repeatedly talked about FTT and risks before. I don't know if you have tasted it. That is more than 89% of the pull-up. There are many good traders and teachers, and they don't ask for anything from you.
5. You can go long or short in both the rising and falling trends, but you cannot do the pattern of these orders that go against the general trend. You can only go long or short in the short term. If you cannot go up or down near the resistance level or support level, you must stop profit first and wait for the next opportunity. There will be long and short positions every day. You can follow the general trend to do the pattern of orders in the right direction, such as going long on the rebound during the rise and going short on the rebound during the downward trend. But no matter which one you do, as long as the price leaves your opening price, you must remember to take the loss to protect your capital. When the price breaks through the new position, you must remember to push the stop loss upwards, so that if it is swept away, at least it will not be in vain.
6. Don’t be lazy. Diligence in trading is reflected in watching the market, reviewing the market, learning, and managing positions, rather than in my continuous high-frequency trading.
7. We fell too fast. At this speed, we can complete the daily level correction within a week, but in this case, the time calculation is wrong. Normally, a correction should take at least 10 to 15 days, and then resume the long position and pull it up for another 10 to 15 days. It only took us 2 days, which is equivalent to a correction of more than 5,000 points from the high point. This speed is really too fast. It is estimated that there will be a 4h level rebound in the middle, and then continue to pull back, or connect a period of volatile market. Under normal circumstances, it is unlikely to complete 2 daily level corrections and rises in about a month. It is estimated that it will take some time later. The correction should be completed around the middle of the month, and the rise should be completed in the middle and late part of the month, and then the correction will start again at the end of the month, which is more reasonable.
I've accidentally said too much nonsense, let's continue to look at today's situation
First look at $BTC
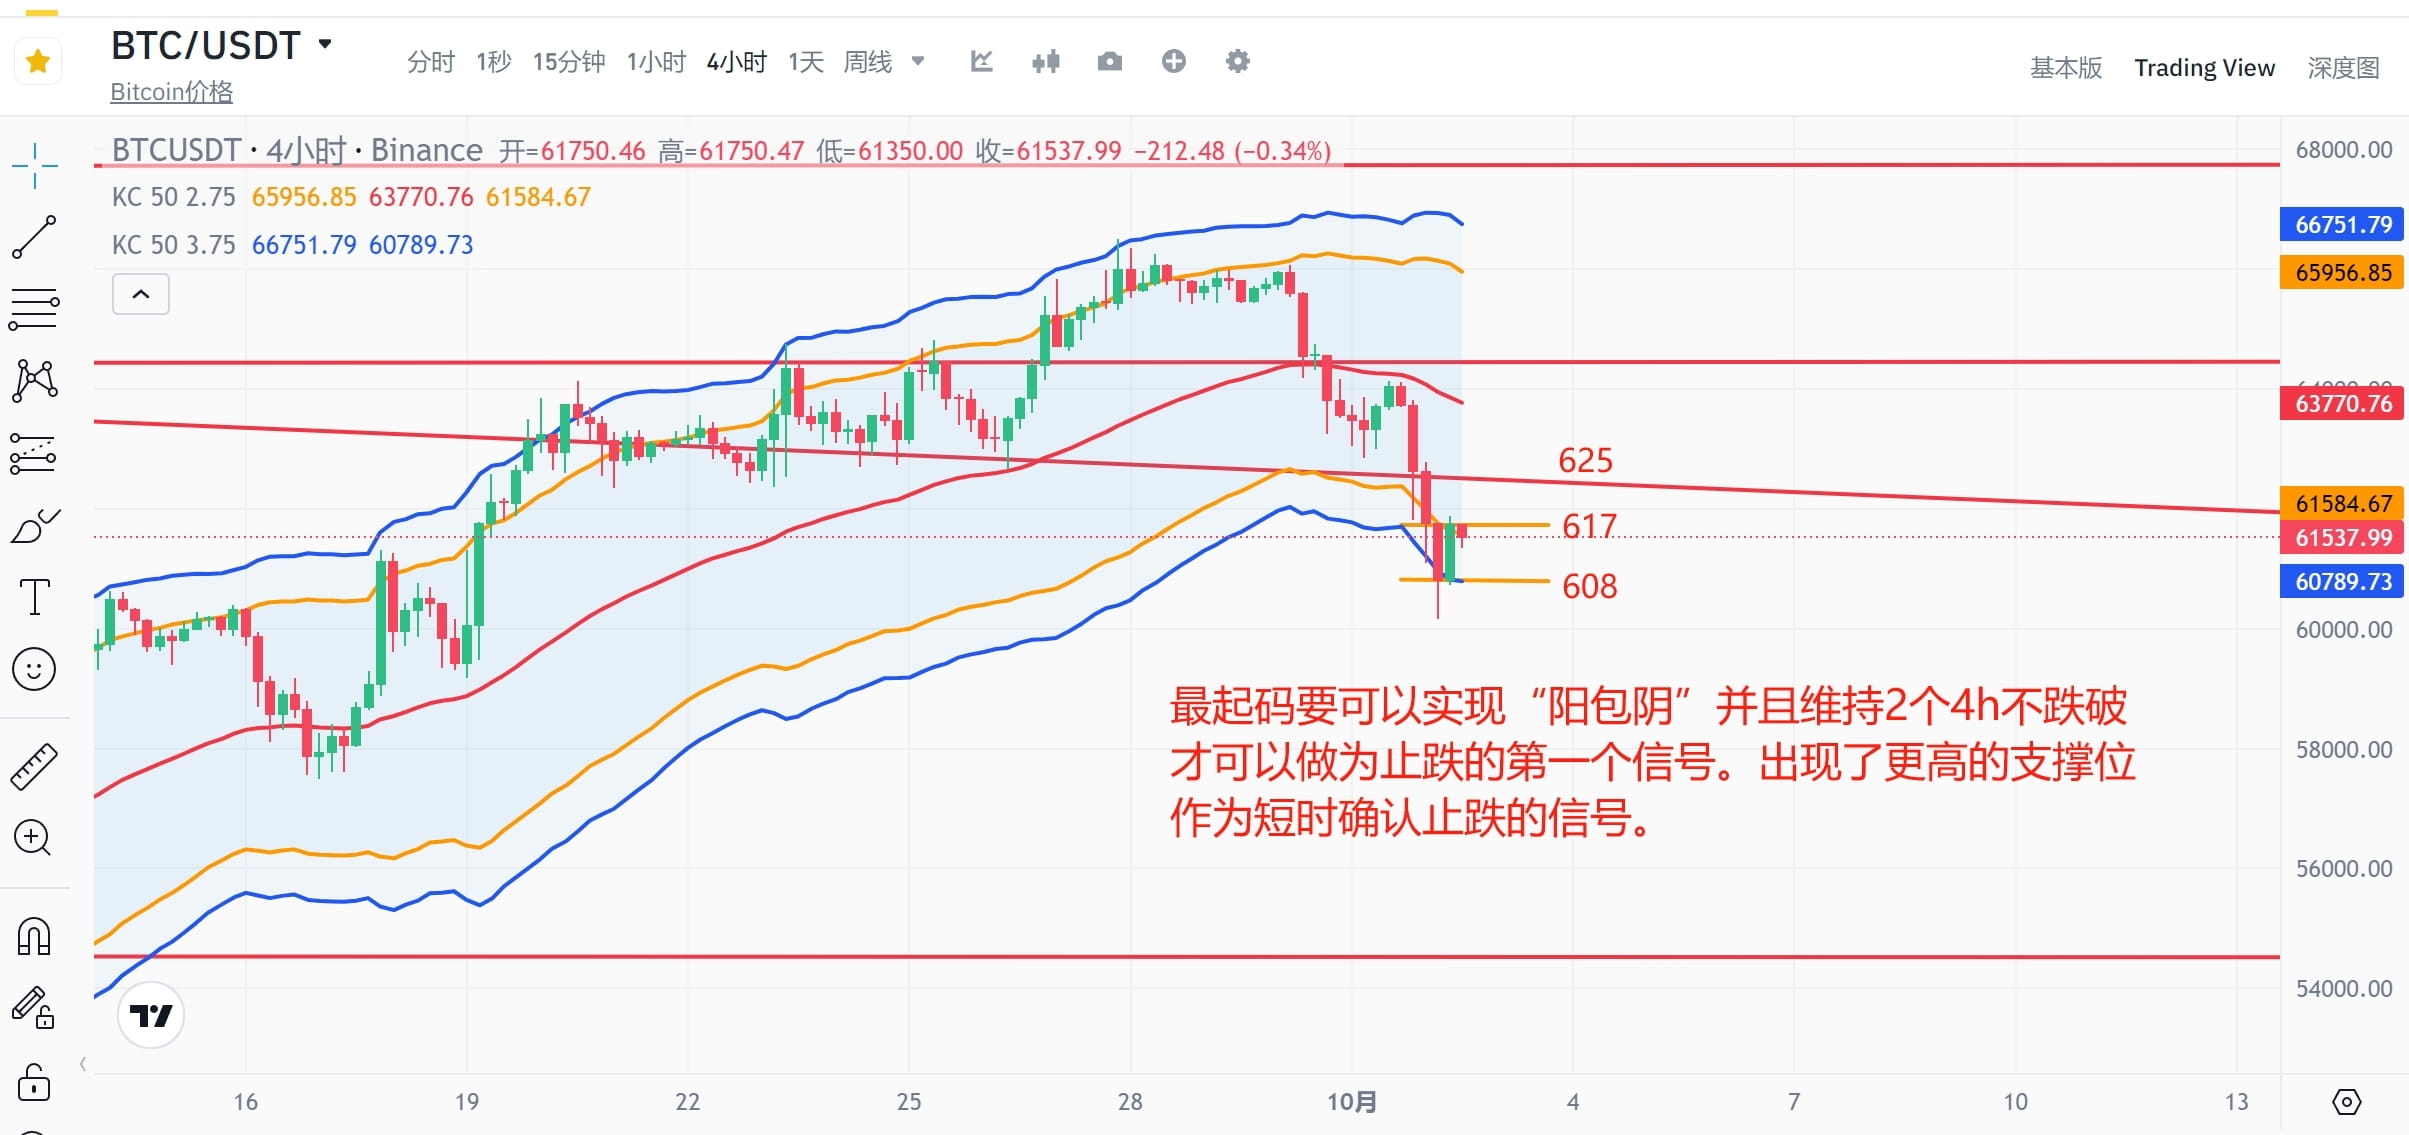
At the 4-hour level, we must at least achieve a positive line covering a negative line and maintain it for 2 4 hours before it can be considered the first signal of a stop-loss. In other words, we must at least maintain it above 617 for 2 4 hours without falling below it. This is considered a preliminary signal. A breakout of 625 and a stable level for 2 4 hours is considered a confirmation of a stop-loss signal. A solid line falling below 608 and closing the 4-hour line below 608 is considered a confirmation signal of a continued pullback.
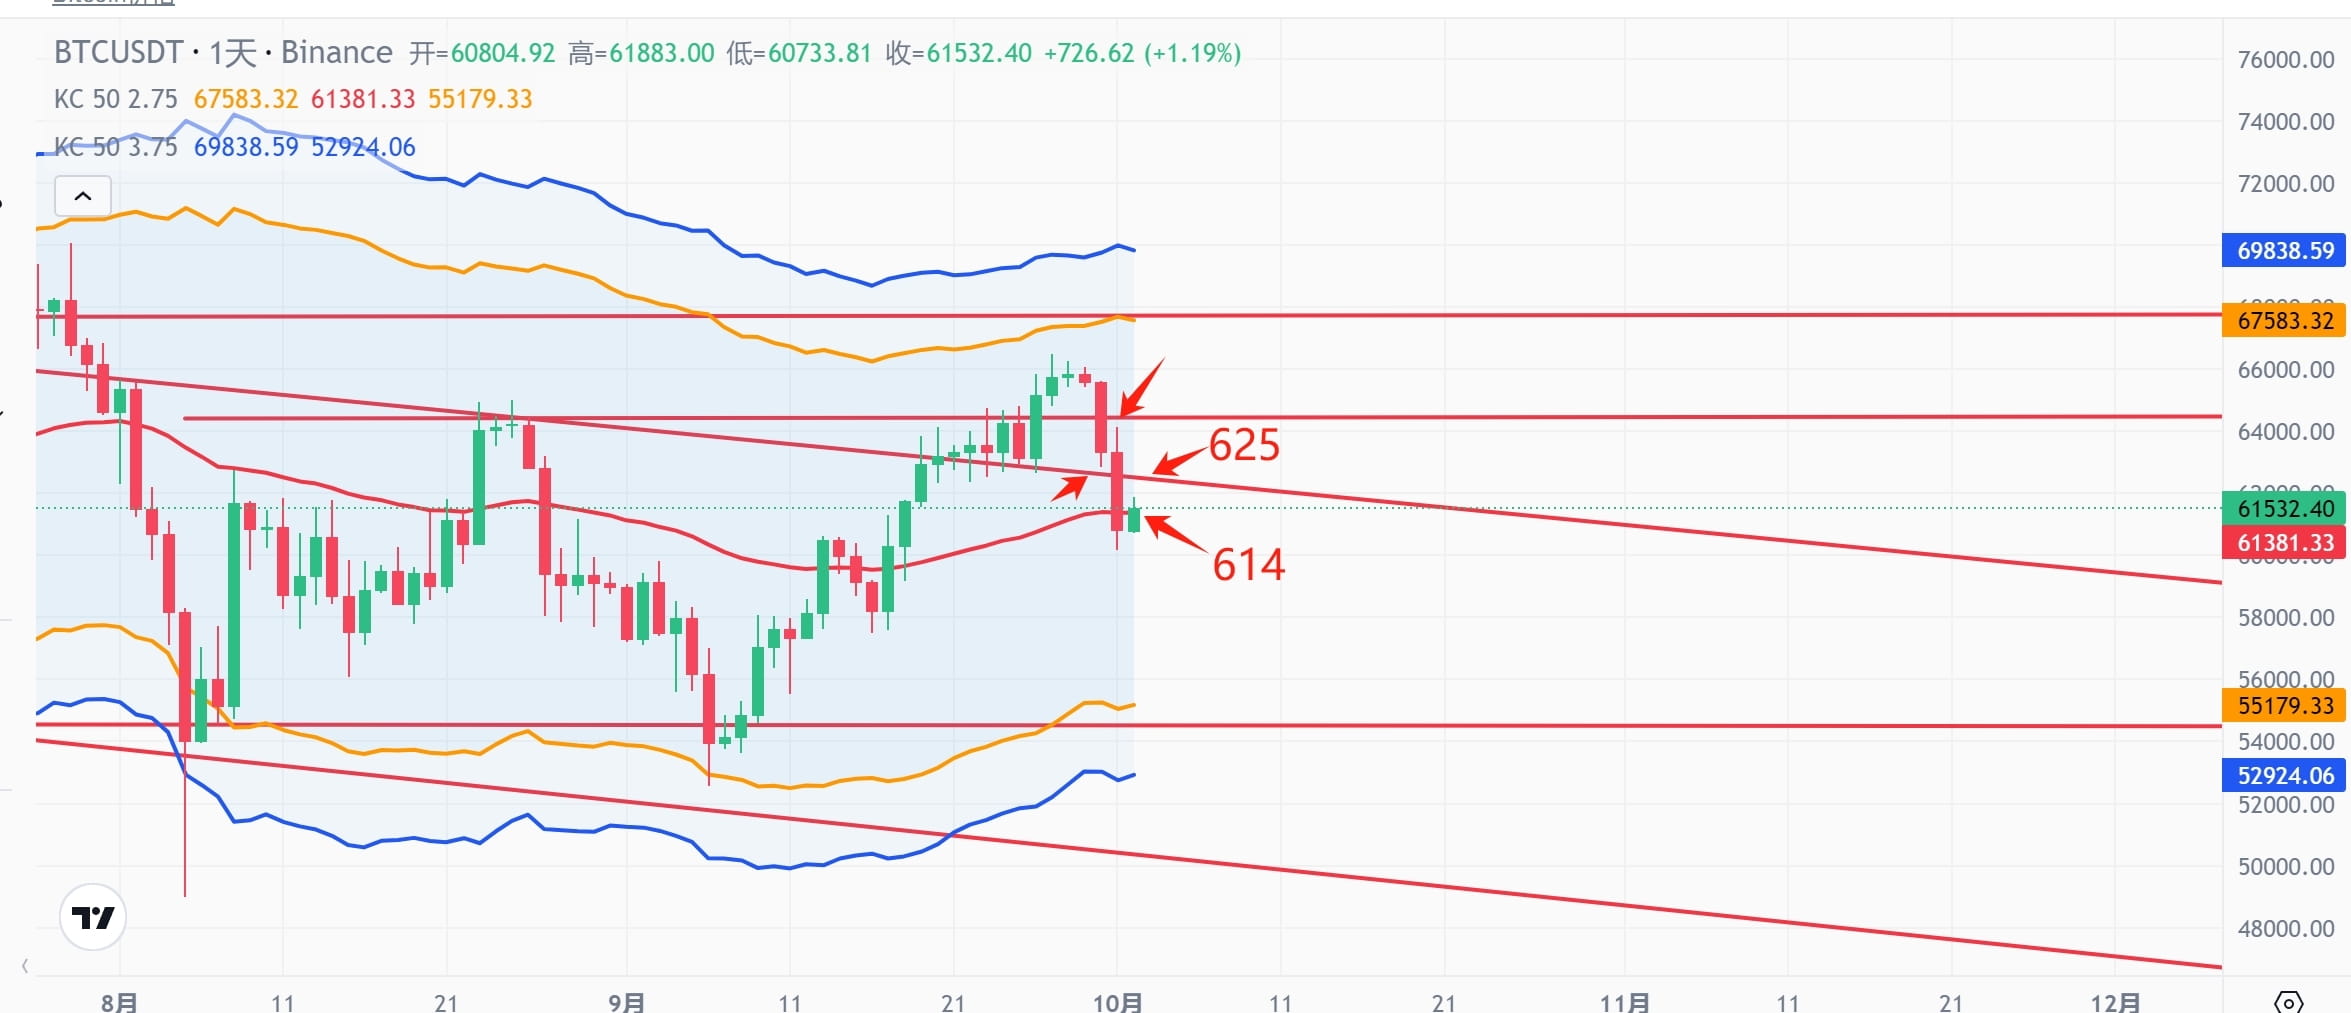
At the daily level, we should pay more attention to the trend line in the middle and its impact on the price, from the retracement without breaking the trend line to the breakthrough, then to the breakout and retracement without breaking the trend line, and the rebound being suppressed by the line and continuing to fall. This can explain what happened in the form and verify the principle of morphology. Here I still recommend that novices can look at Wyckoff. The indicator may deviate, but the form will not deceive people most of the time, it's just whether you believe it will go that way. At the daily level, as long as we can maintain above 614, we are still long at the daily level, although it is very dangerous to run against the middle track. The daily line can still break through 625 and retrace without breaking, which is a signal to confirm the resumption of longs. It can confirm the signal of continuing the daily level correction by breaking through 614 and being suppressed by 614.
It will be more obvious on the weekly chart
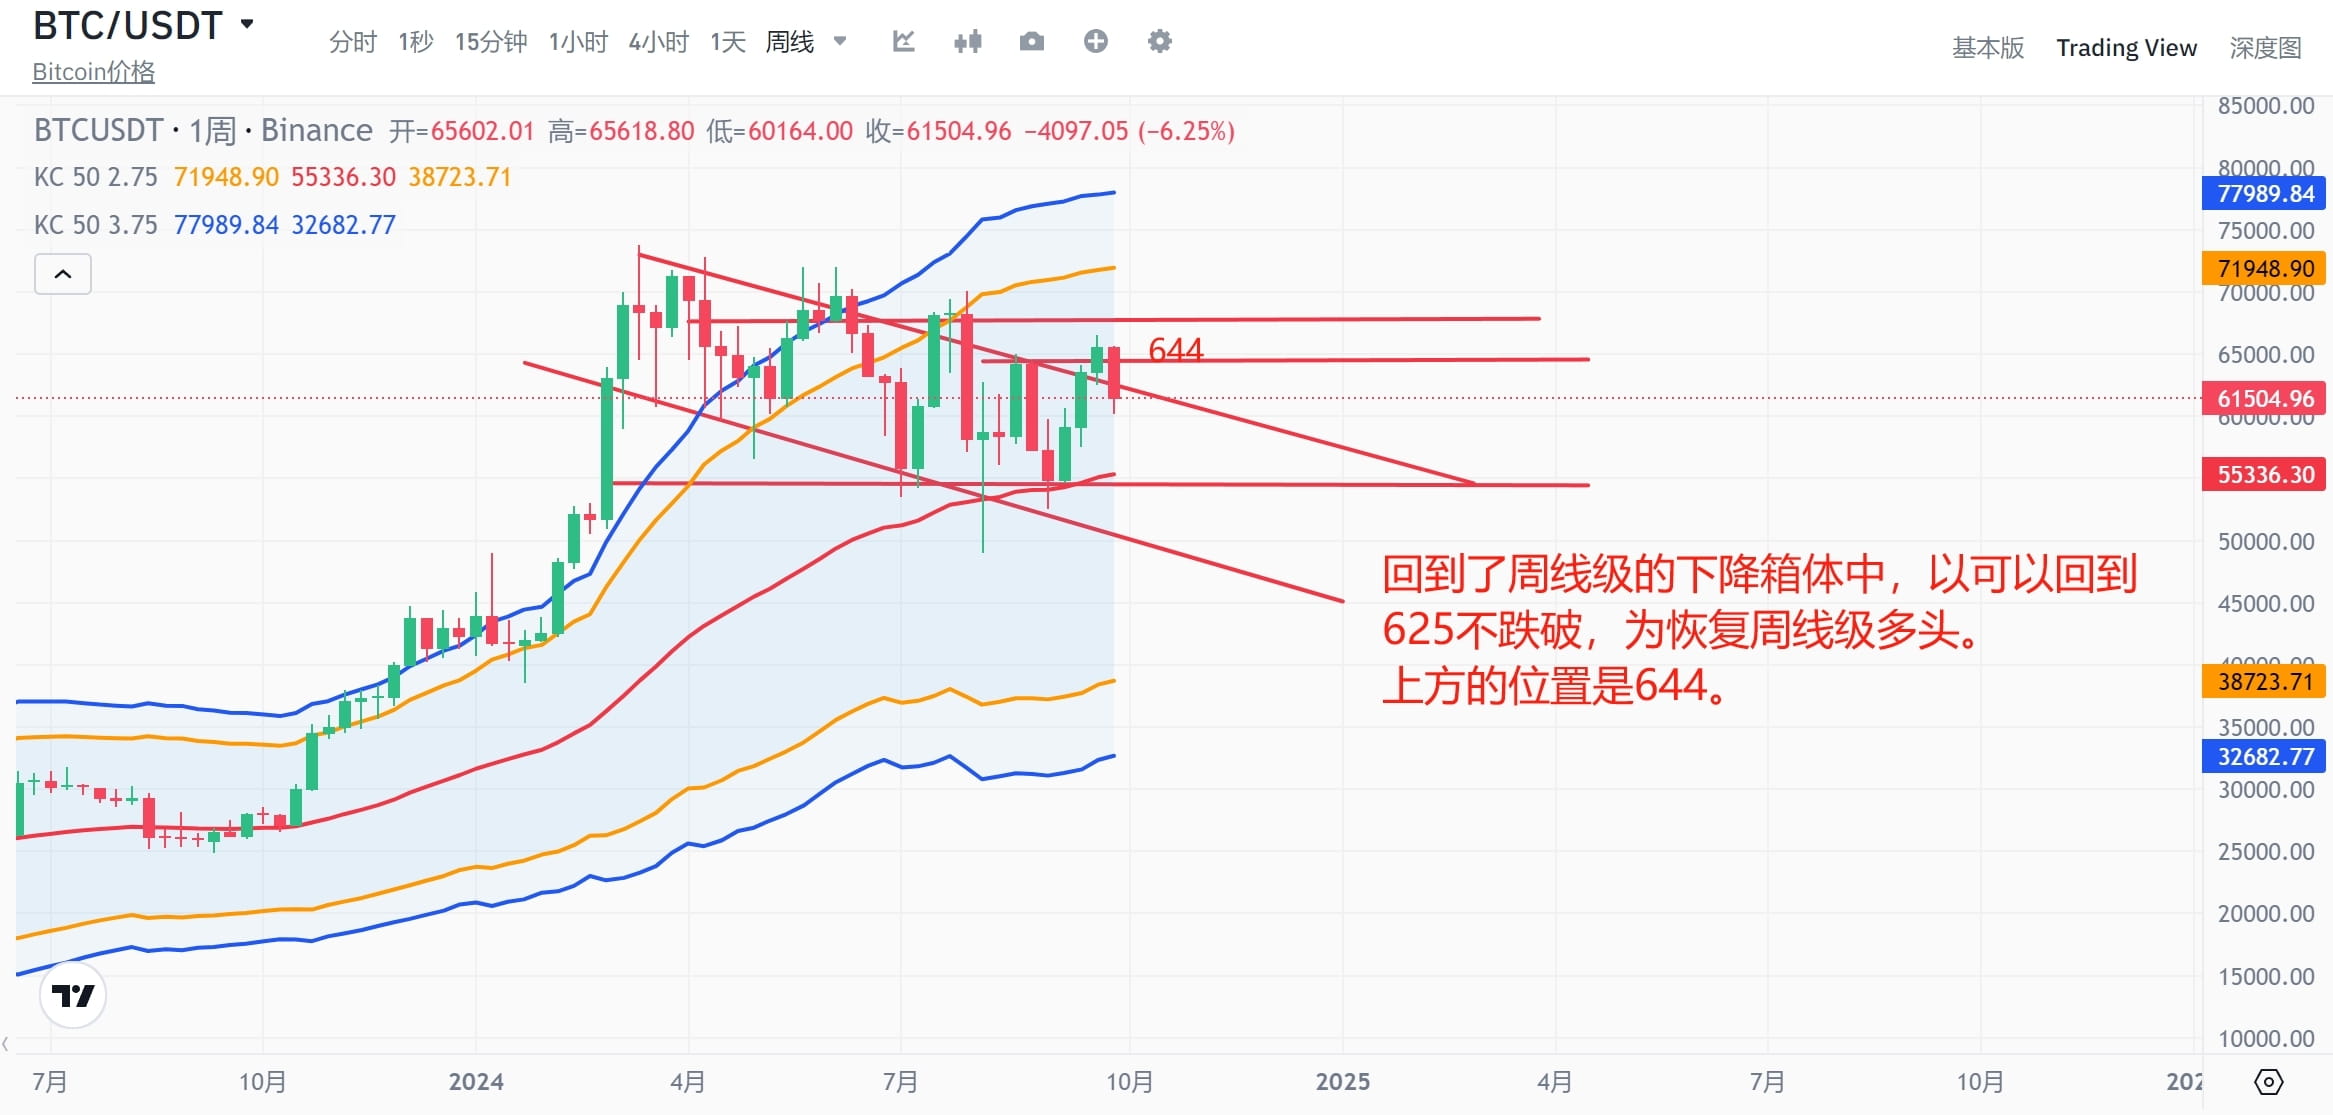
The larger the time level, the more intuitive it is to see the current position and operation, but correspondingly, the higher/lower the position that needs to be confirmed, the longer it takes to confirm. If the weekly closing line is below 625, it is confirmed that it has returned to the weekly falling box. The rest is to see at which position the decline is stopped and whether the bottom will be raised. The current weekly middle track price is 553, and the pin may break here, but this is the most likely potential bottom.
Continue watching $ETH
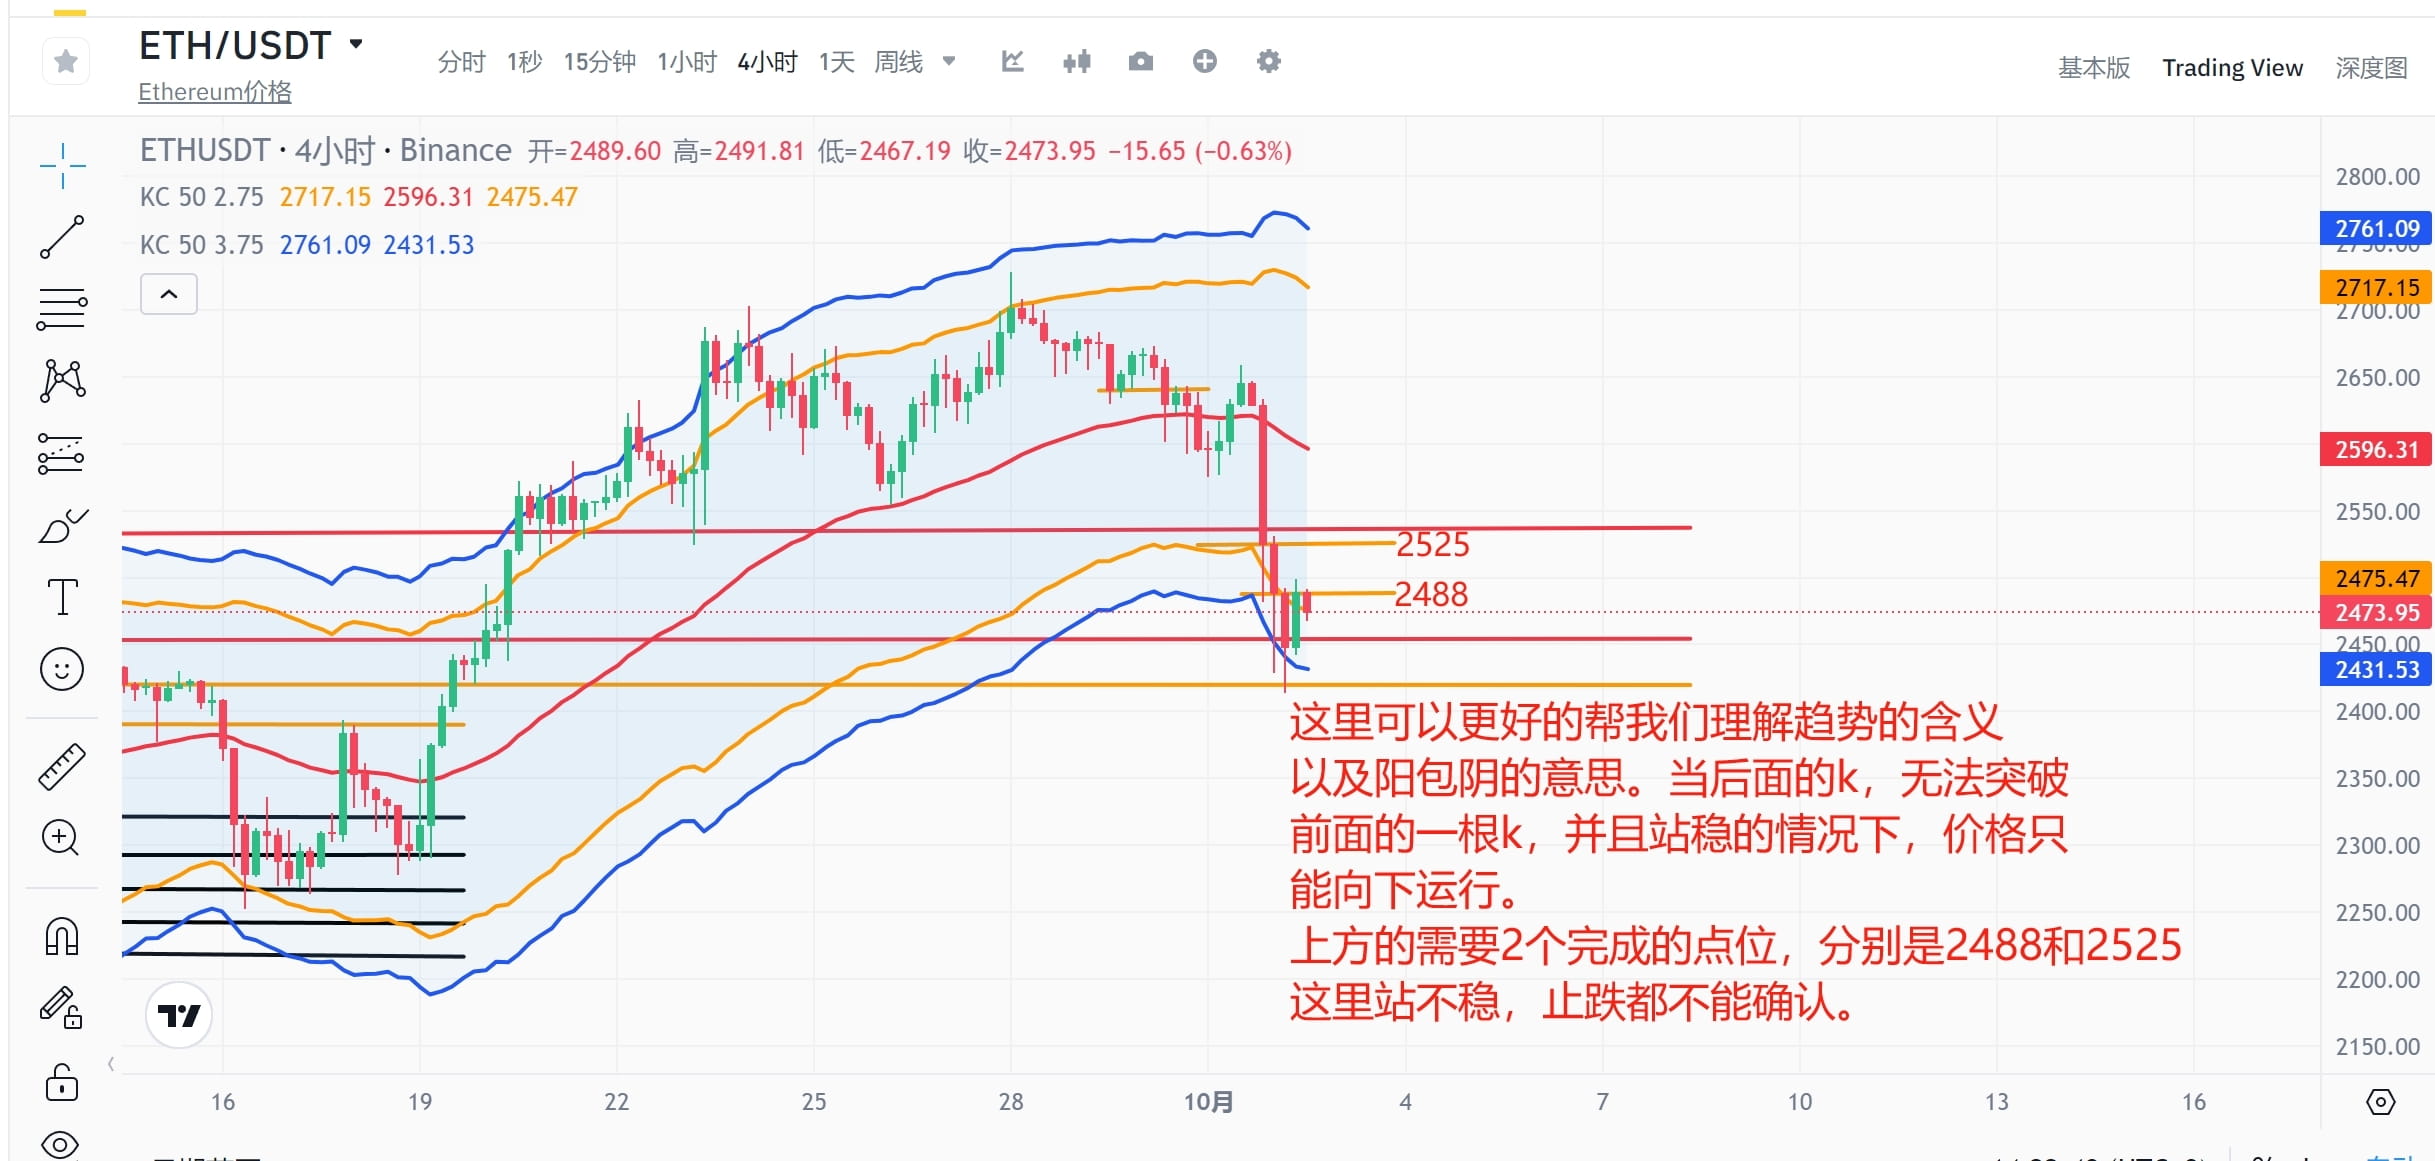
The K at the 4-hour level can actually help us understand the meaning of the trend and the meaning of Yang enveloping Yin/Yin enveloping Yang. At the 4-hour level, starting from the previous K, as long as the following Yang line cannot envelop the previous Yin line, or the closing line cannot raise the bottom, it will continue to move downward. The two prices to complete the initial confirmation of the stop loss at the 4-hour level are 2488, and the price to confirm the stop loss is 2525. If these two positions are not given, then we can only understand that the rise is a rebound to lure more. It is based on being able to stand firm for 2 4-hour periods without falling below.
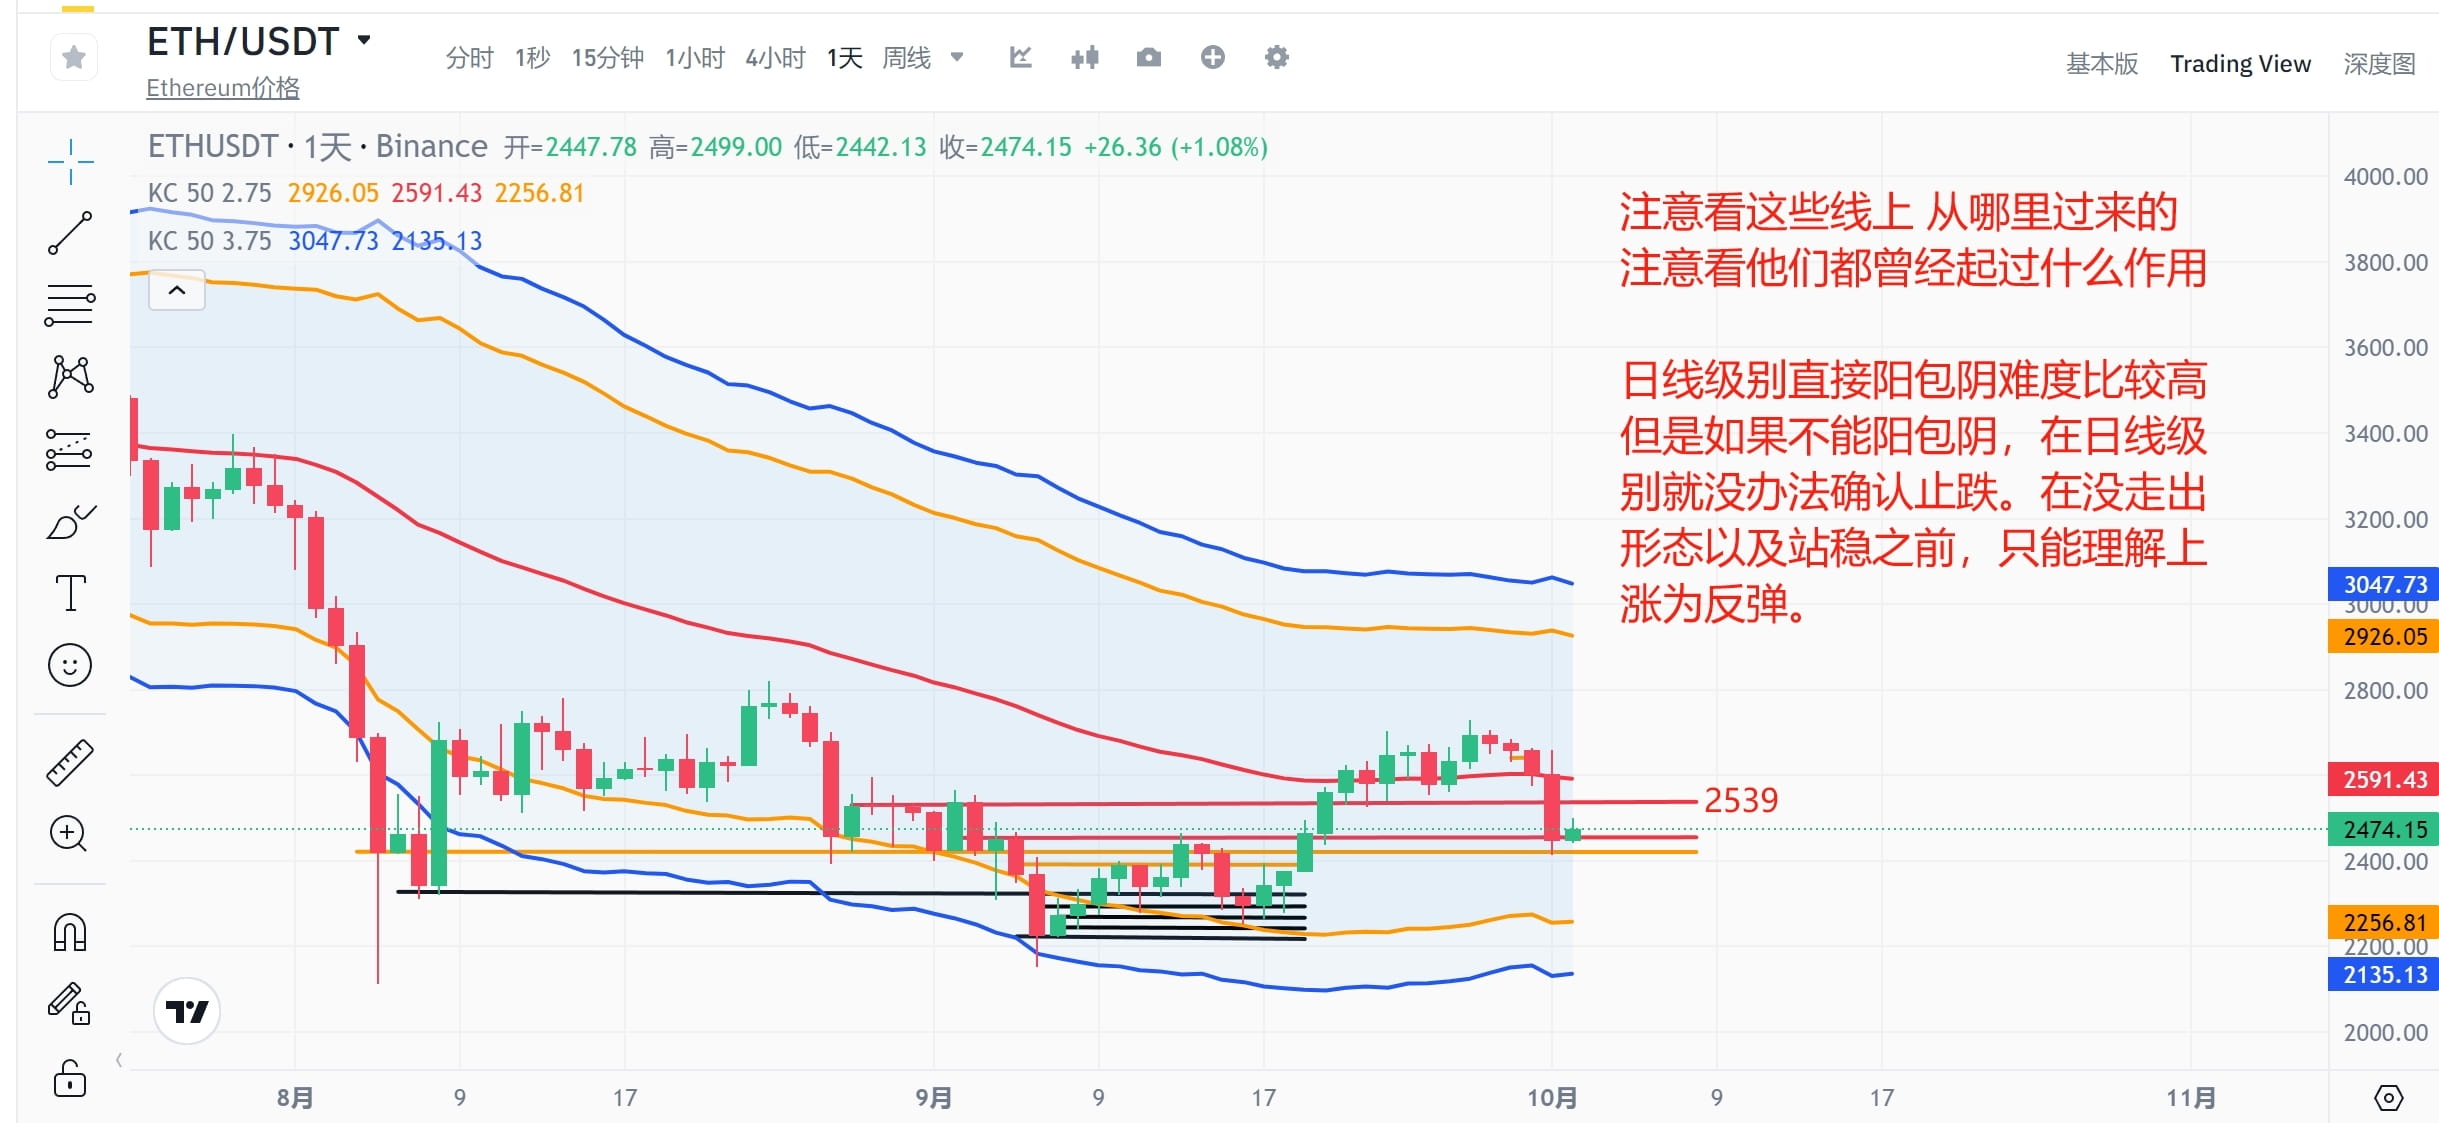
I have not continued to draw these lines since the market was disturbed, because it was meaningless to draw them during that period. Now let's take a look at where these lines extend from. I tell you again that no position that can stop the price from running appears out of thin air. This kind of daily and 4-hour level marks all the support and resistance situations, which is more accurate than Fibonacci, and can also help you better judge the current position. If it does not fall below, you can buy more, and if it does not rise above, you can sell short. Where to buy more and where to sell short are all clear positions. At the daily level, it is very difficult to directly achieve Yang Enveloping Yin, but as long as the daily line cannot close above 2539, it cannot be confirmed that the daily level has stopped falling. So for the time being, we can only continue to look at the callback, and the closing below 2452 is the confirmation signal to confirm the continuation of the daily level callback.
Continue watching $SOL
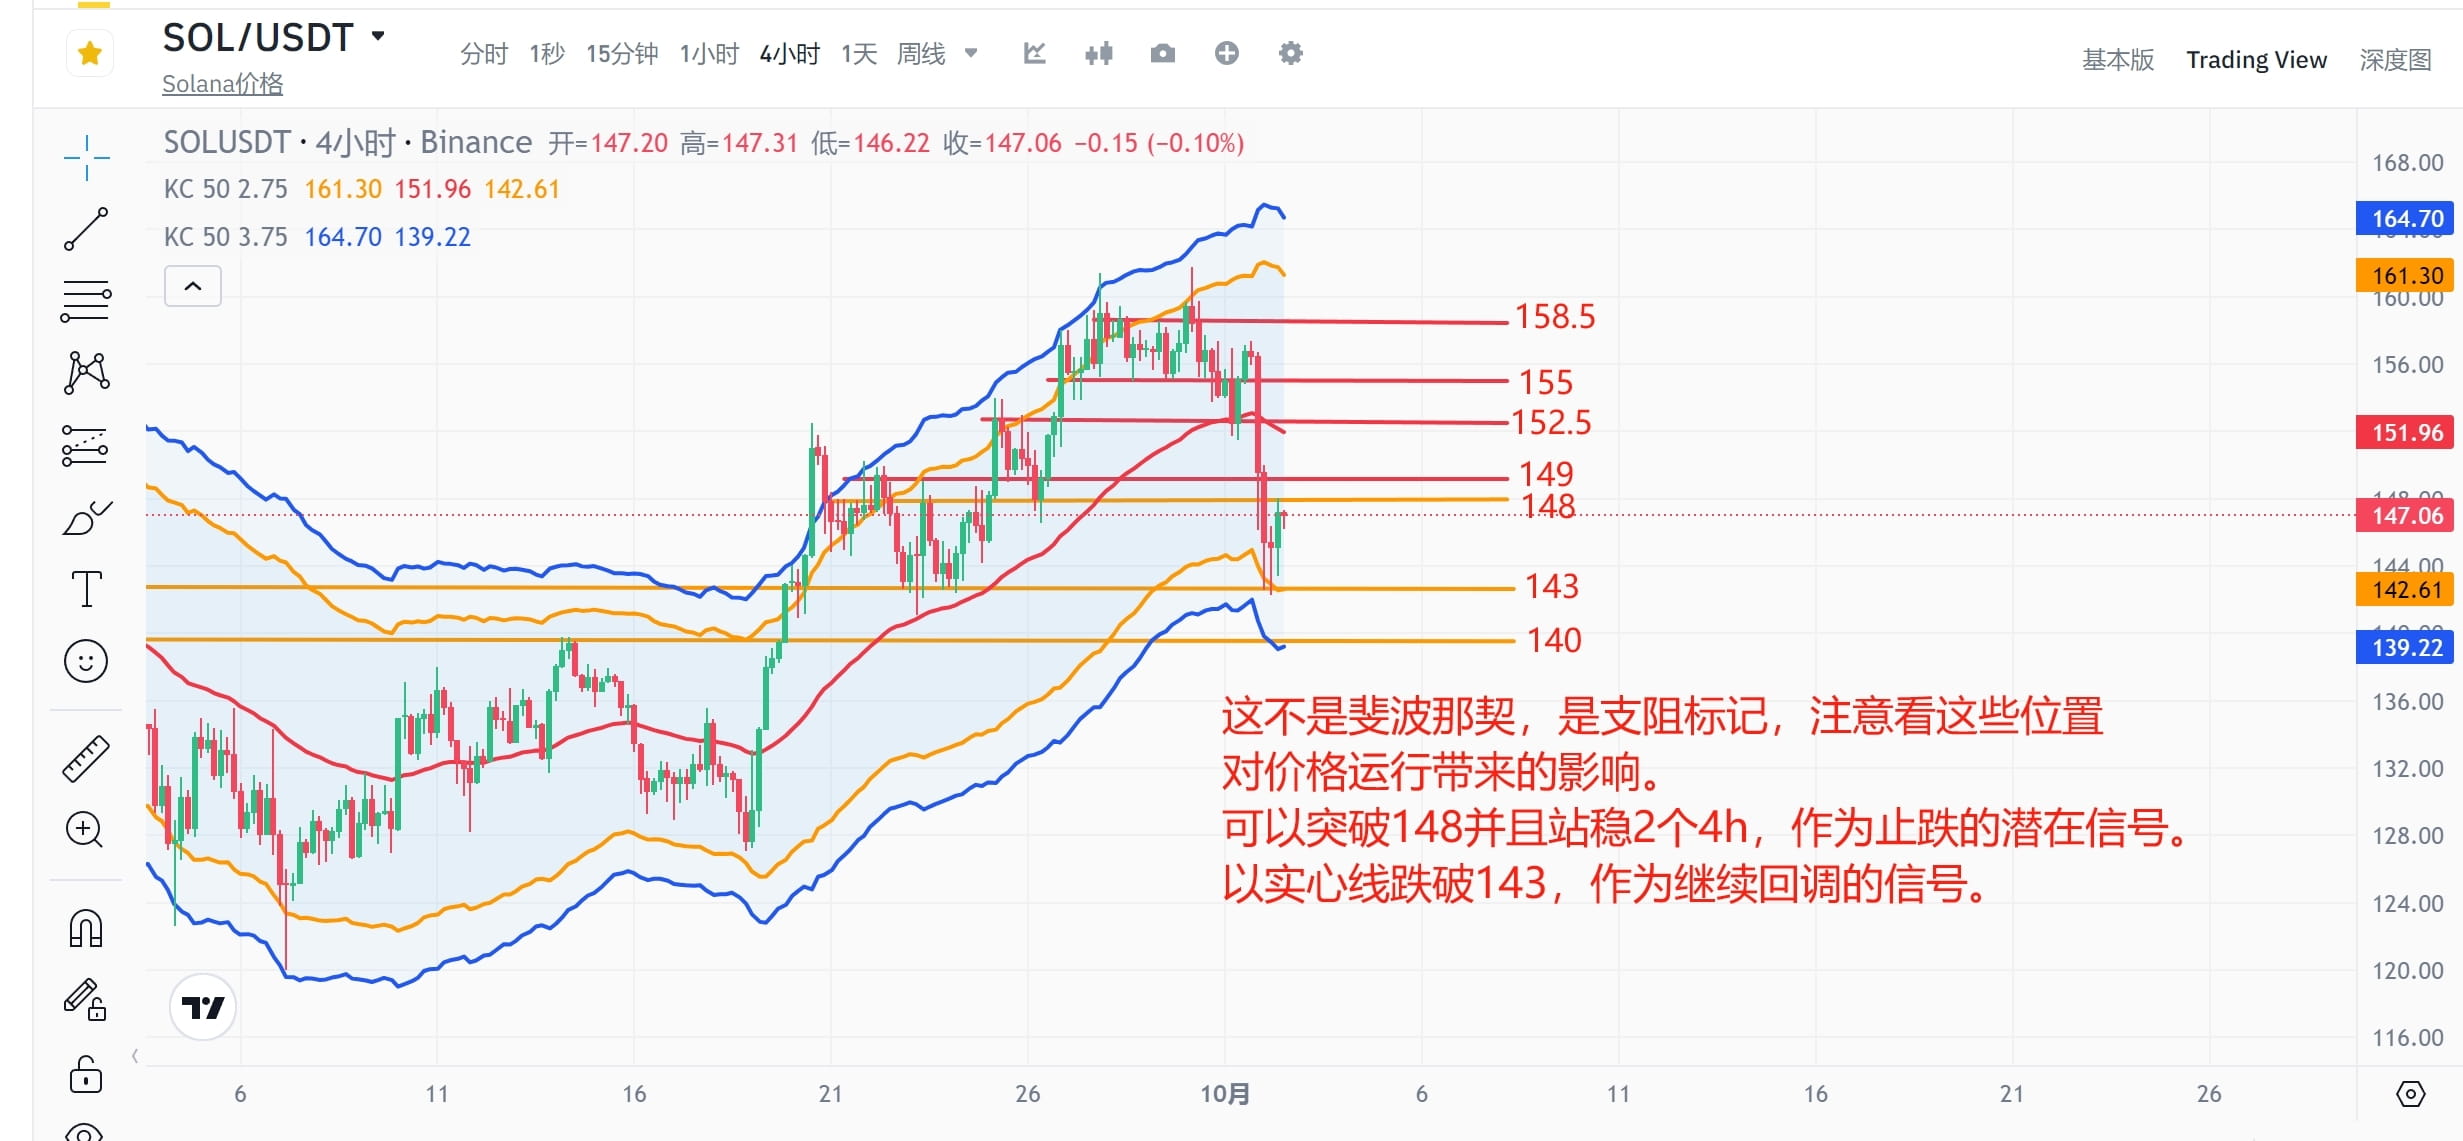
Sol here is the situation of marking support and resistance, which can be well seen on the chart, and their impact on price movement. At the 4-hour level, we take a breakout of 148 and a 2-hour 4-hour break as a potential signal to stop the decline. A close below 143 is a signal to continue the correction.
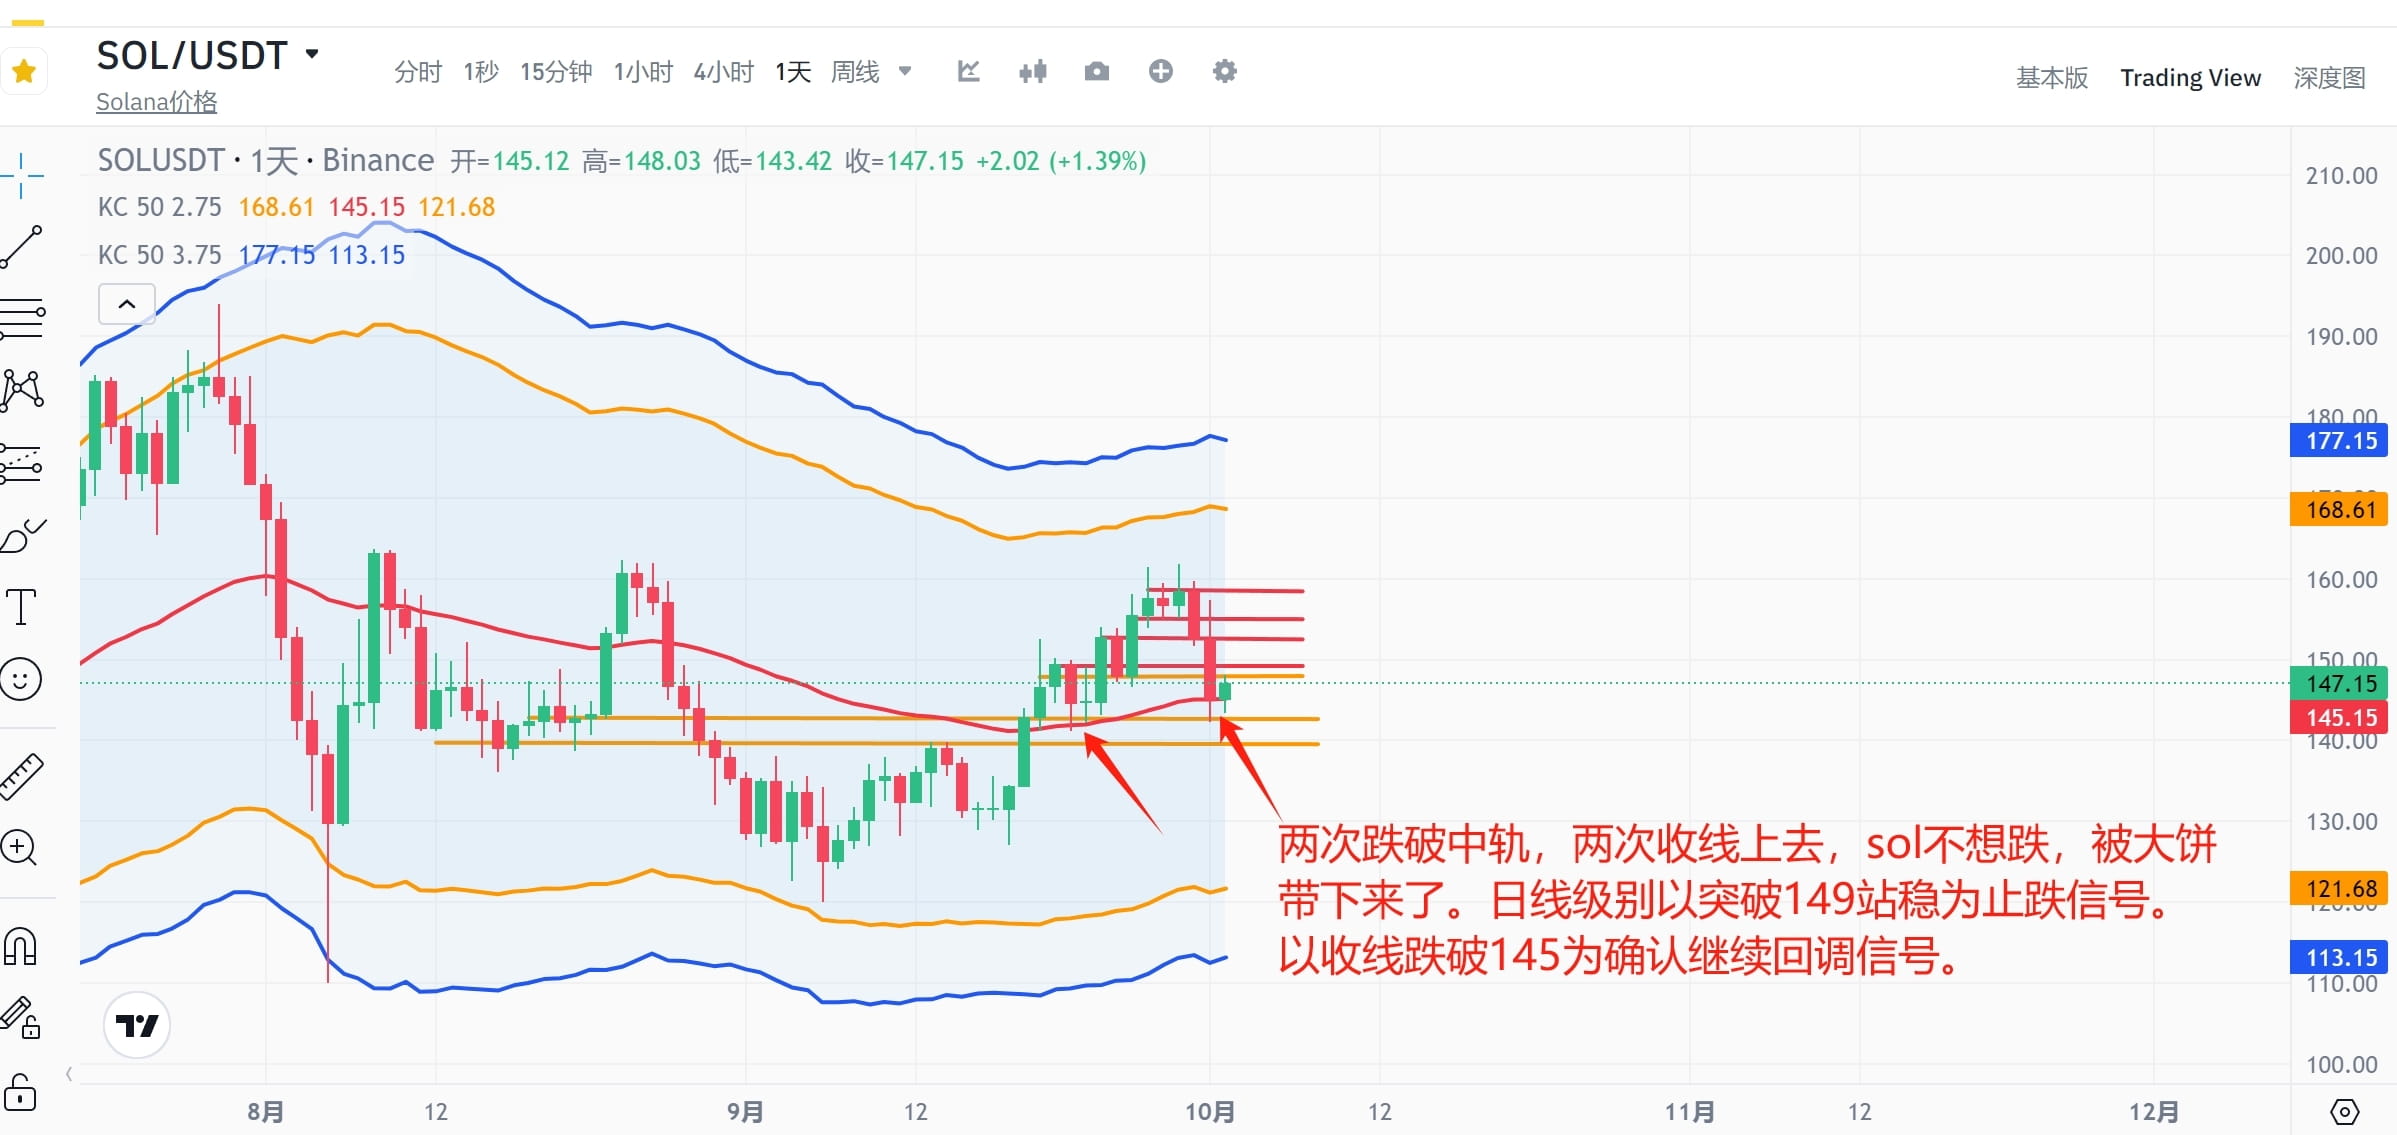
At the daily level, it fell below the middle line twice and closed up twice. It can be clearly seen that Sol did not want to fall, but was brought down by the big cake. At the daily level, closing at 149 is a stop-loss signal. Closing below 145 is a signal to confirm the continuation of the daily level correction.
Finally, let’s take a look at BNB
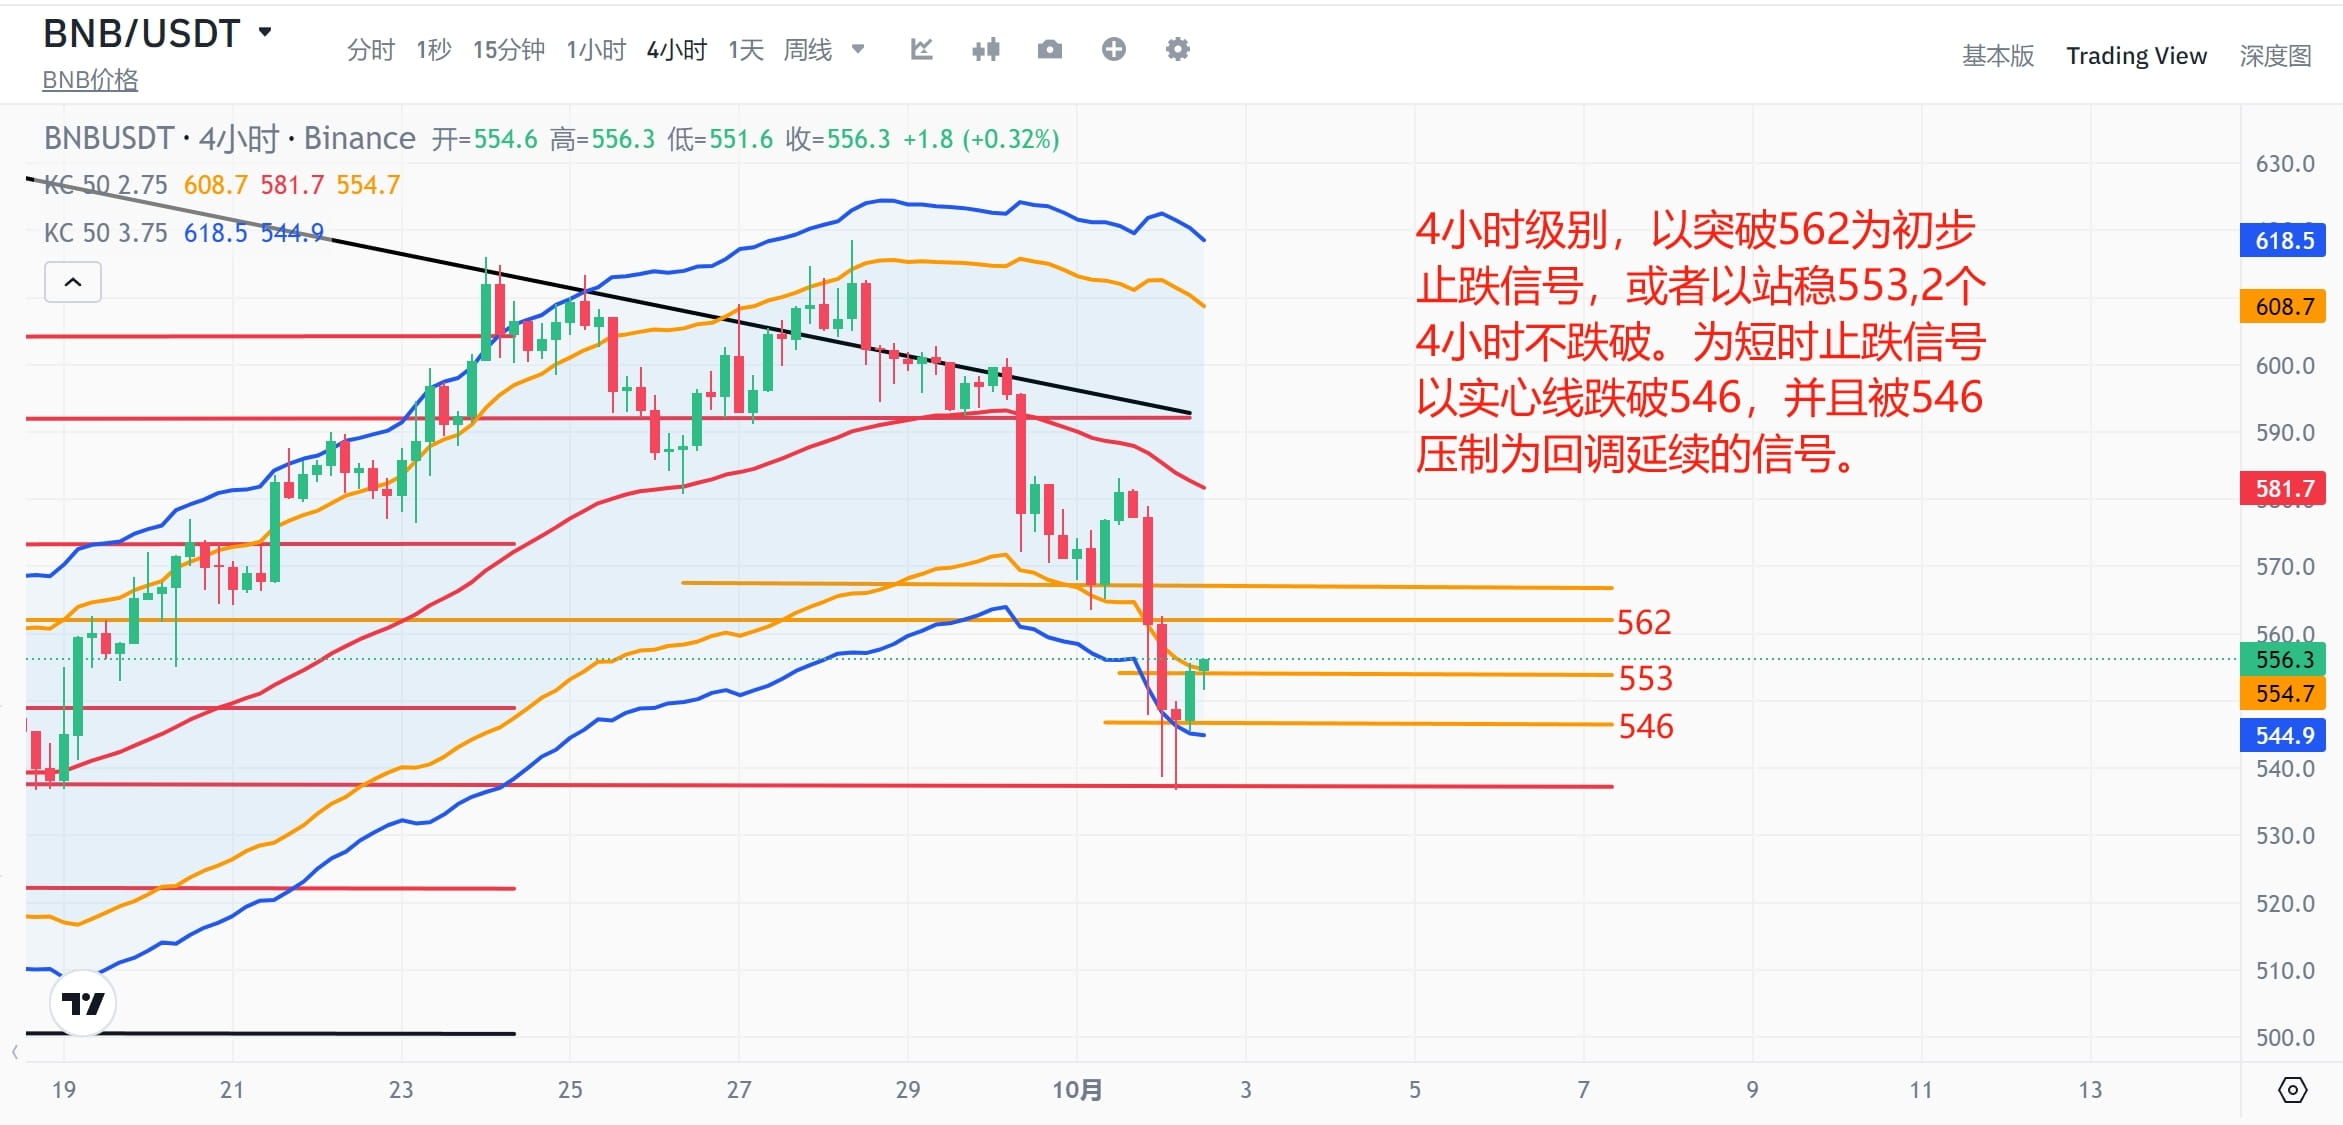
At the 4-hour level, a breakout of 562 and a stable level for 2 4-hour periods is a short-term stop-loss signal. Here, we can pay attention to 553. If this level can be maintained for 2 4-hour periods without breaking, it can also be used as a potential stop-loss signal because the bottom is raised. A close below 546 and being suppressed by 546 for 2 4-hour periods is a signal to confirm the continuation of the pullback.
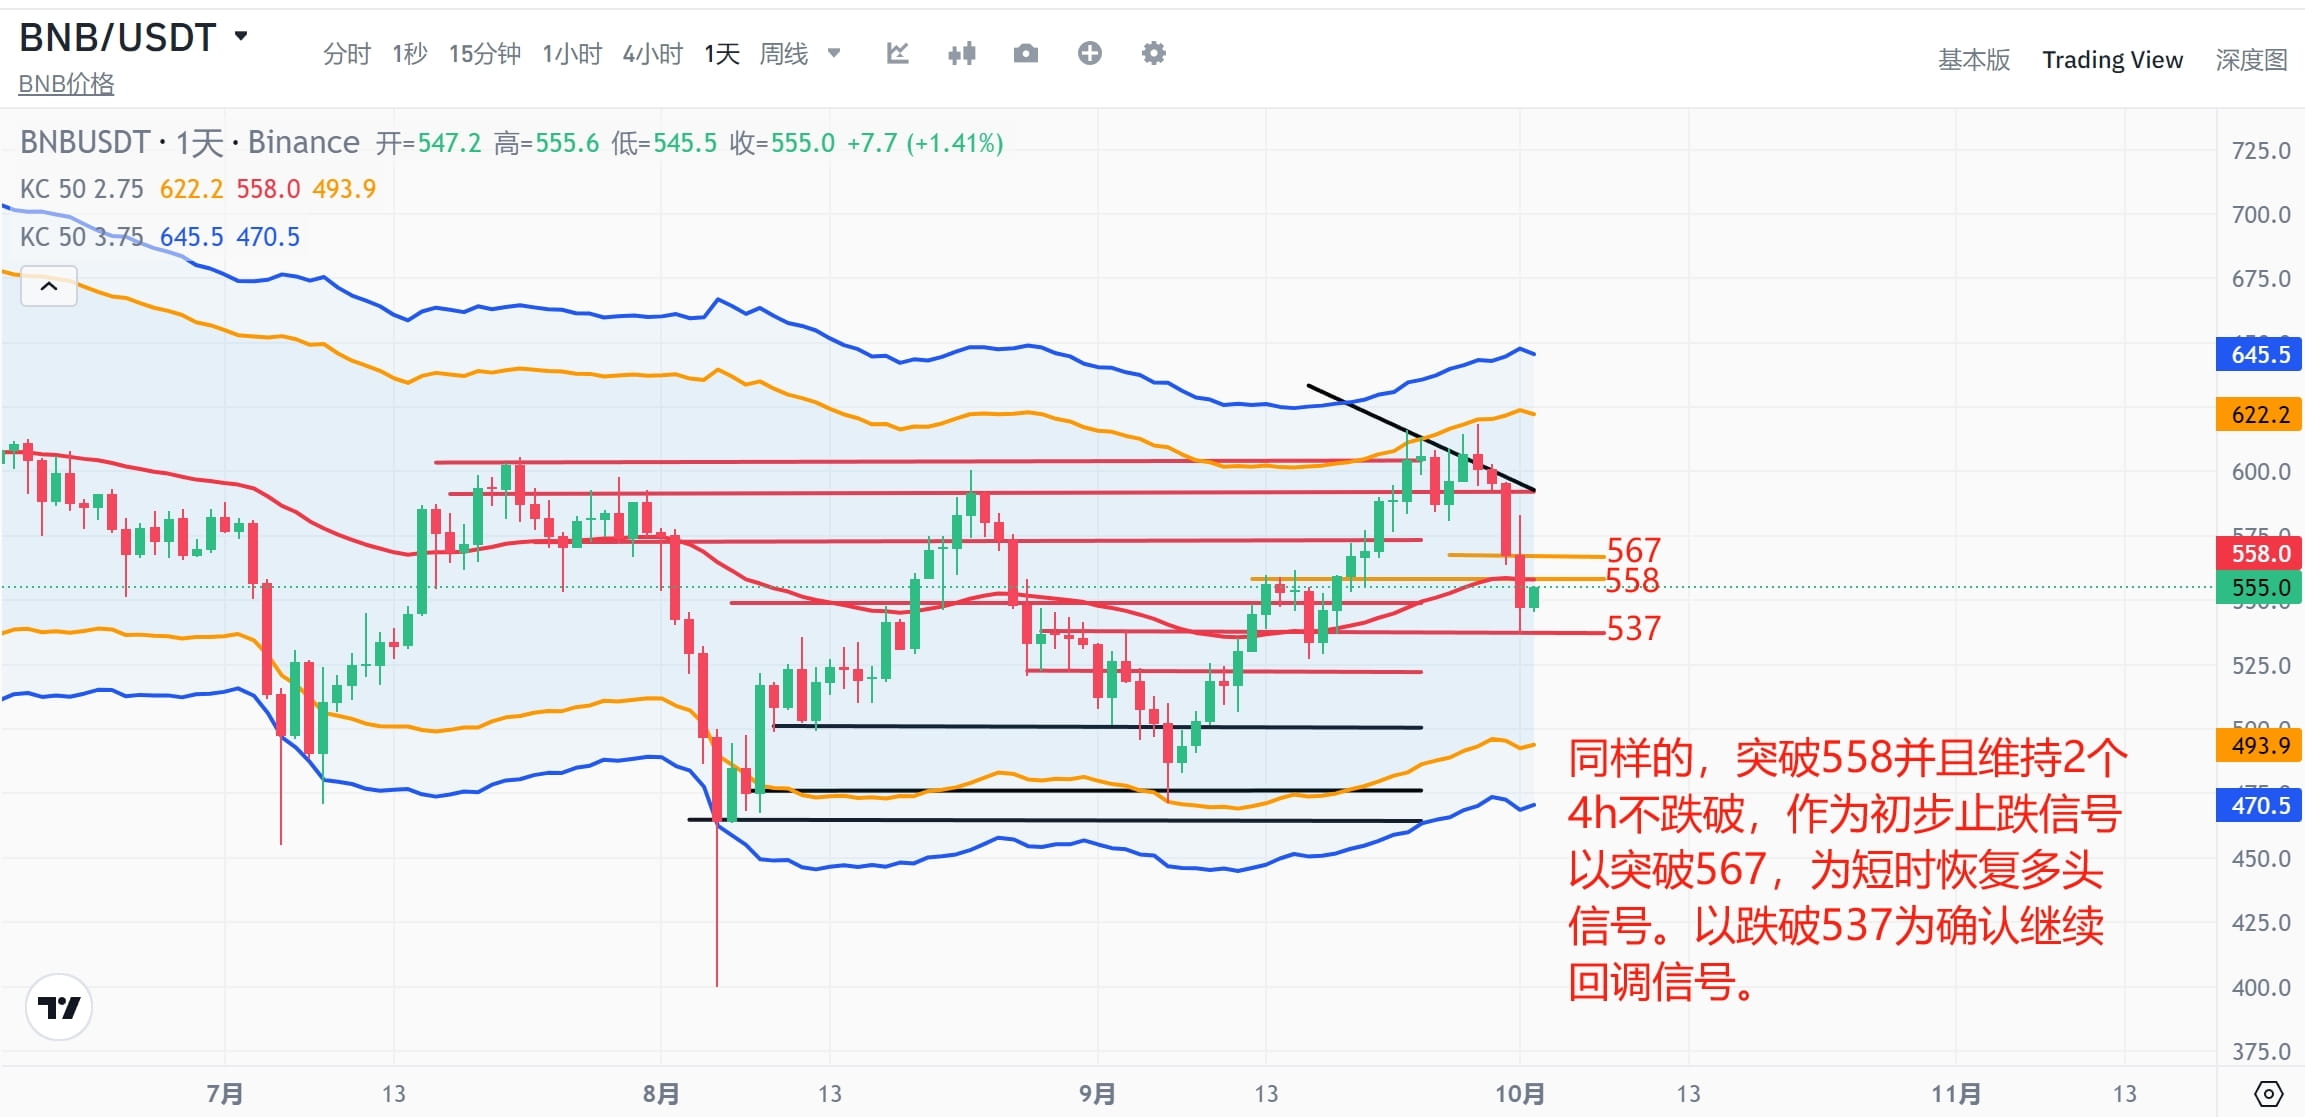
On the daily chart, you can see more clearly the impact of these positions on price movement. How to connect the needle? Is it clear at a glance? I only picked a few lines and moved them back a little. This line has been drawn for several days and has not been drawn, so it ran to the left. The closing line below 537 is the confirmation signal for the daily level correction. The closing line above 558 is the confirmation signal for the stop loss, and the closing line above 567 is the confirmation signal for the resumption of long positions.