TradeWhale
@Square-Creator-8516ecd34f33
Following
Followers
Liked
Shared
See original
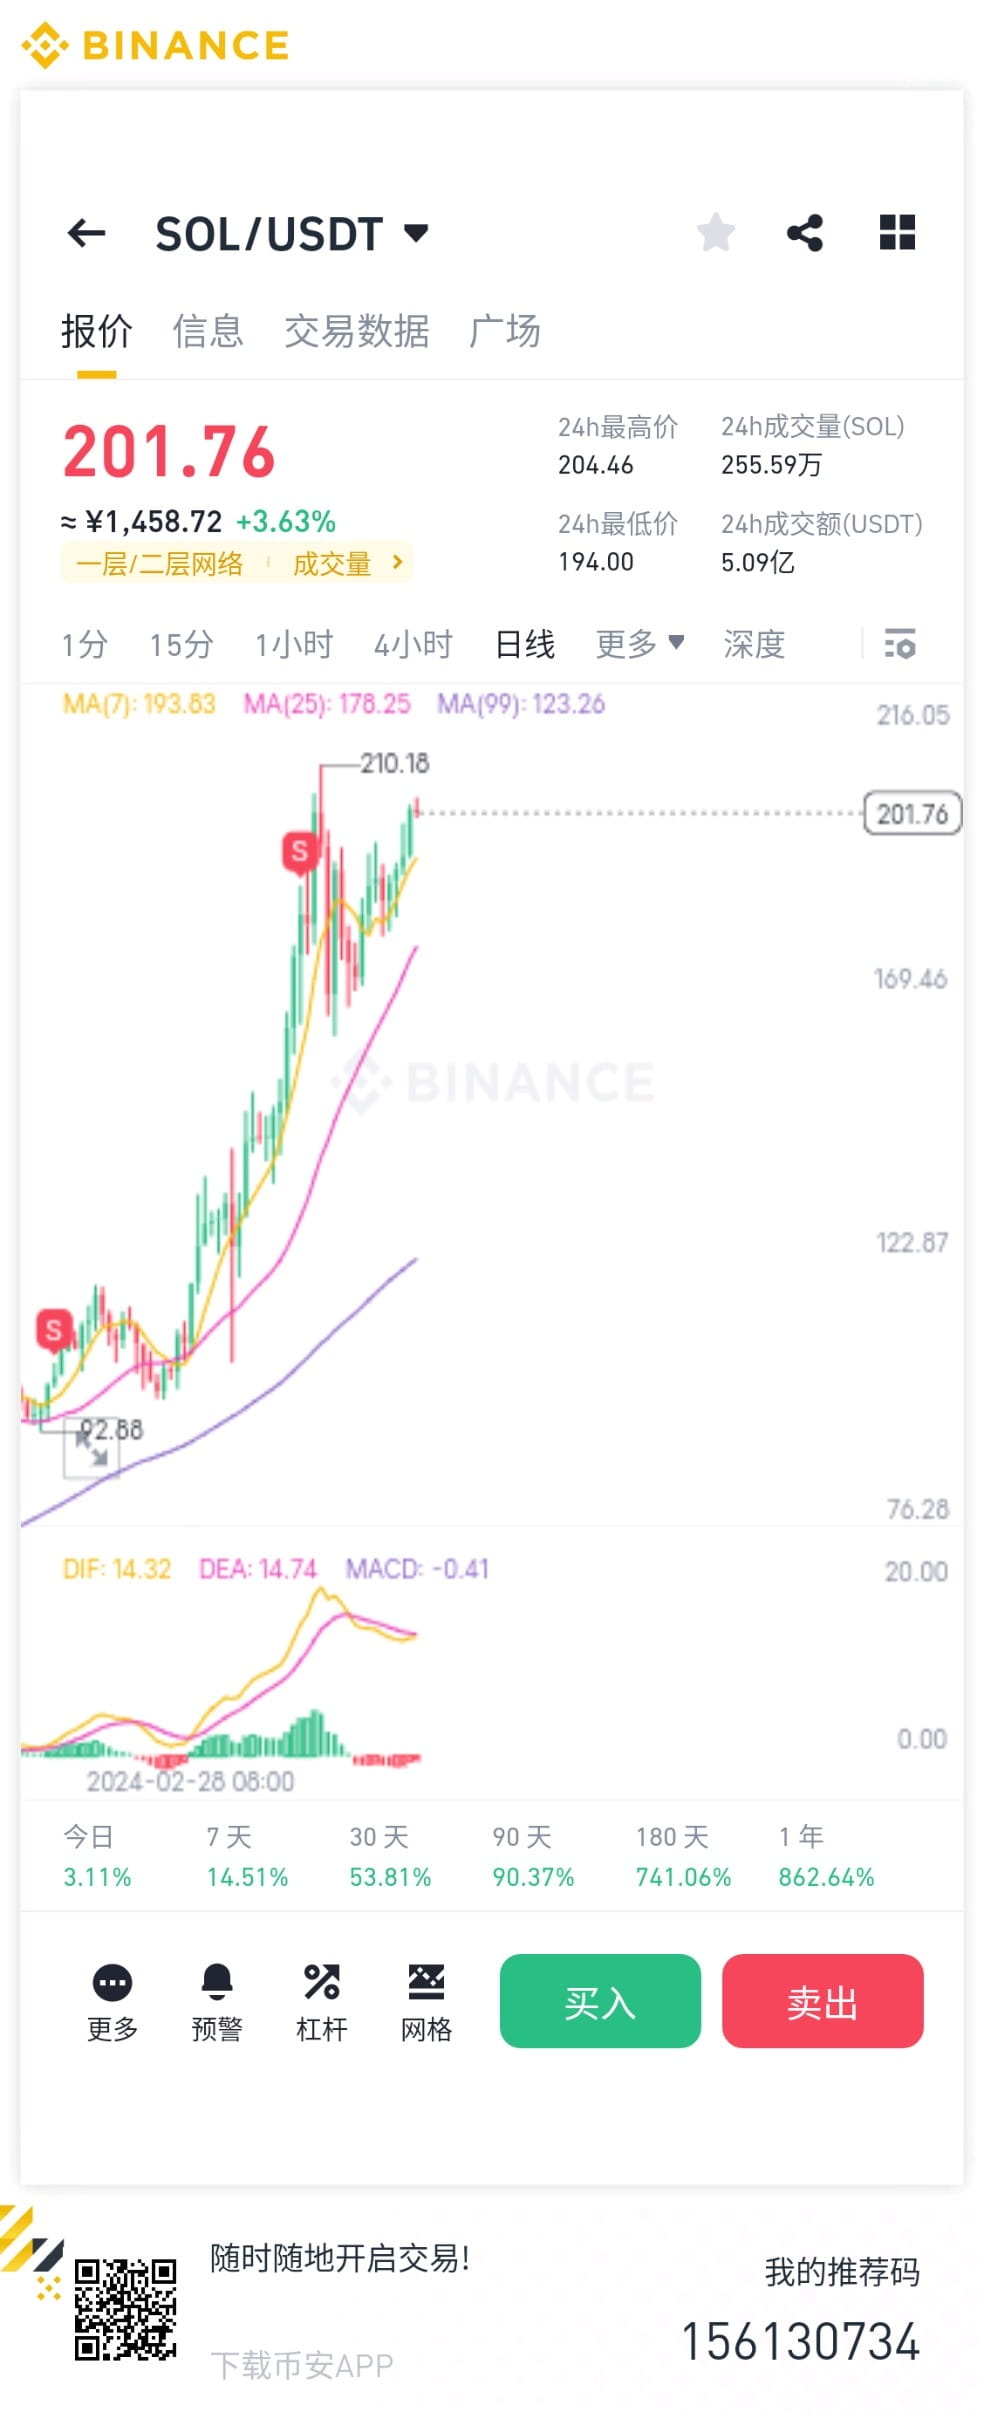
[SOL buying and selling points]
-Buying point one: 195.00USDT (near the recent 4-hour K-line support level, if the price pulls back here, there may be buying orders)
-Buying point two: 190.00USDT (the low on March 30 in the daily K-line, if it falls below the 195.00USDT support, the next potential support level is here)
-Long stop loss point: 187.50USDT (slightly lower than the buy point 2, for conservative reasons, set below the 1-day EMA7 and EMA30 moving average)
-Selling point one: 204.00USDT (close to the high point in the 4-hour cycle in recent days, which can be used as an initial selling area)
-Selling point two: 210.00USDT (near the historical high since March 18, if there is a strong breakthrough, you can consider further holding)
-Short stop loss point: 215.00USDT (exceeding the selling point two, in order to prevent the upward trend from continuing, set above the recent high)
$SOL $BTC $ETH
#大盘走势 #Solana #BTC超话

See original
[SOL price trend analysis] 4-hour price trend: sideways
1. K-line pattern:
-The recent 4-hour K-line shows that the price fluctuates greatly, and there are many K-lines with long upper and lower shadows, indicating that the market is in fierce competition between buyers and sellers in this price range
-From the daily K-line, there was a continuous rise from March 30 to April 1, but the latest K-line is a small negative line, which may indicate that the upward momentum is weakening
2. Technical indicators:
-In the MACD indicator, DIF and DEA are both in the positive area, and the MACD bar chart shows a shrinking state, suggesting that the current upward trend has slowed down
-The KDJ indicator shows that both the K-line and the D-line are running at high levels, and the J-line is slightly overbought. If the K-line and the D-line have a dead cross, it may be a callback signal
-EMA7 line is always above the EMA30 line, indicating that the short-term trend is relatively strong, but the gap between the two is gradually narrowing. It is necessary to pay attention to whether the short-term moving average will cross the long-term moving average downward
3. Trading volume:
-In the 4-hour cycle, the trading volume increases when the price rises and decreases when the price falls, which conforms to the conventional relationship between price and trading volume
-At the daily K-line level, the trading volume has decreased in recent days compared with the previous period, which may mean that the upward momentum is insufficient, and it is necessary to be vigilant about the possible price callback risk in the future
$SOL $JUP $JTO
#大盘走势 #Solana #BTC
See original
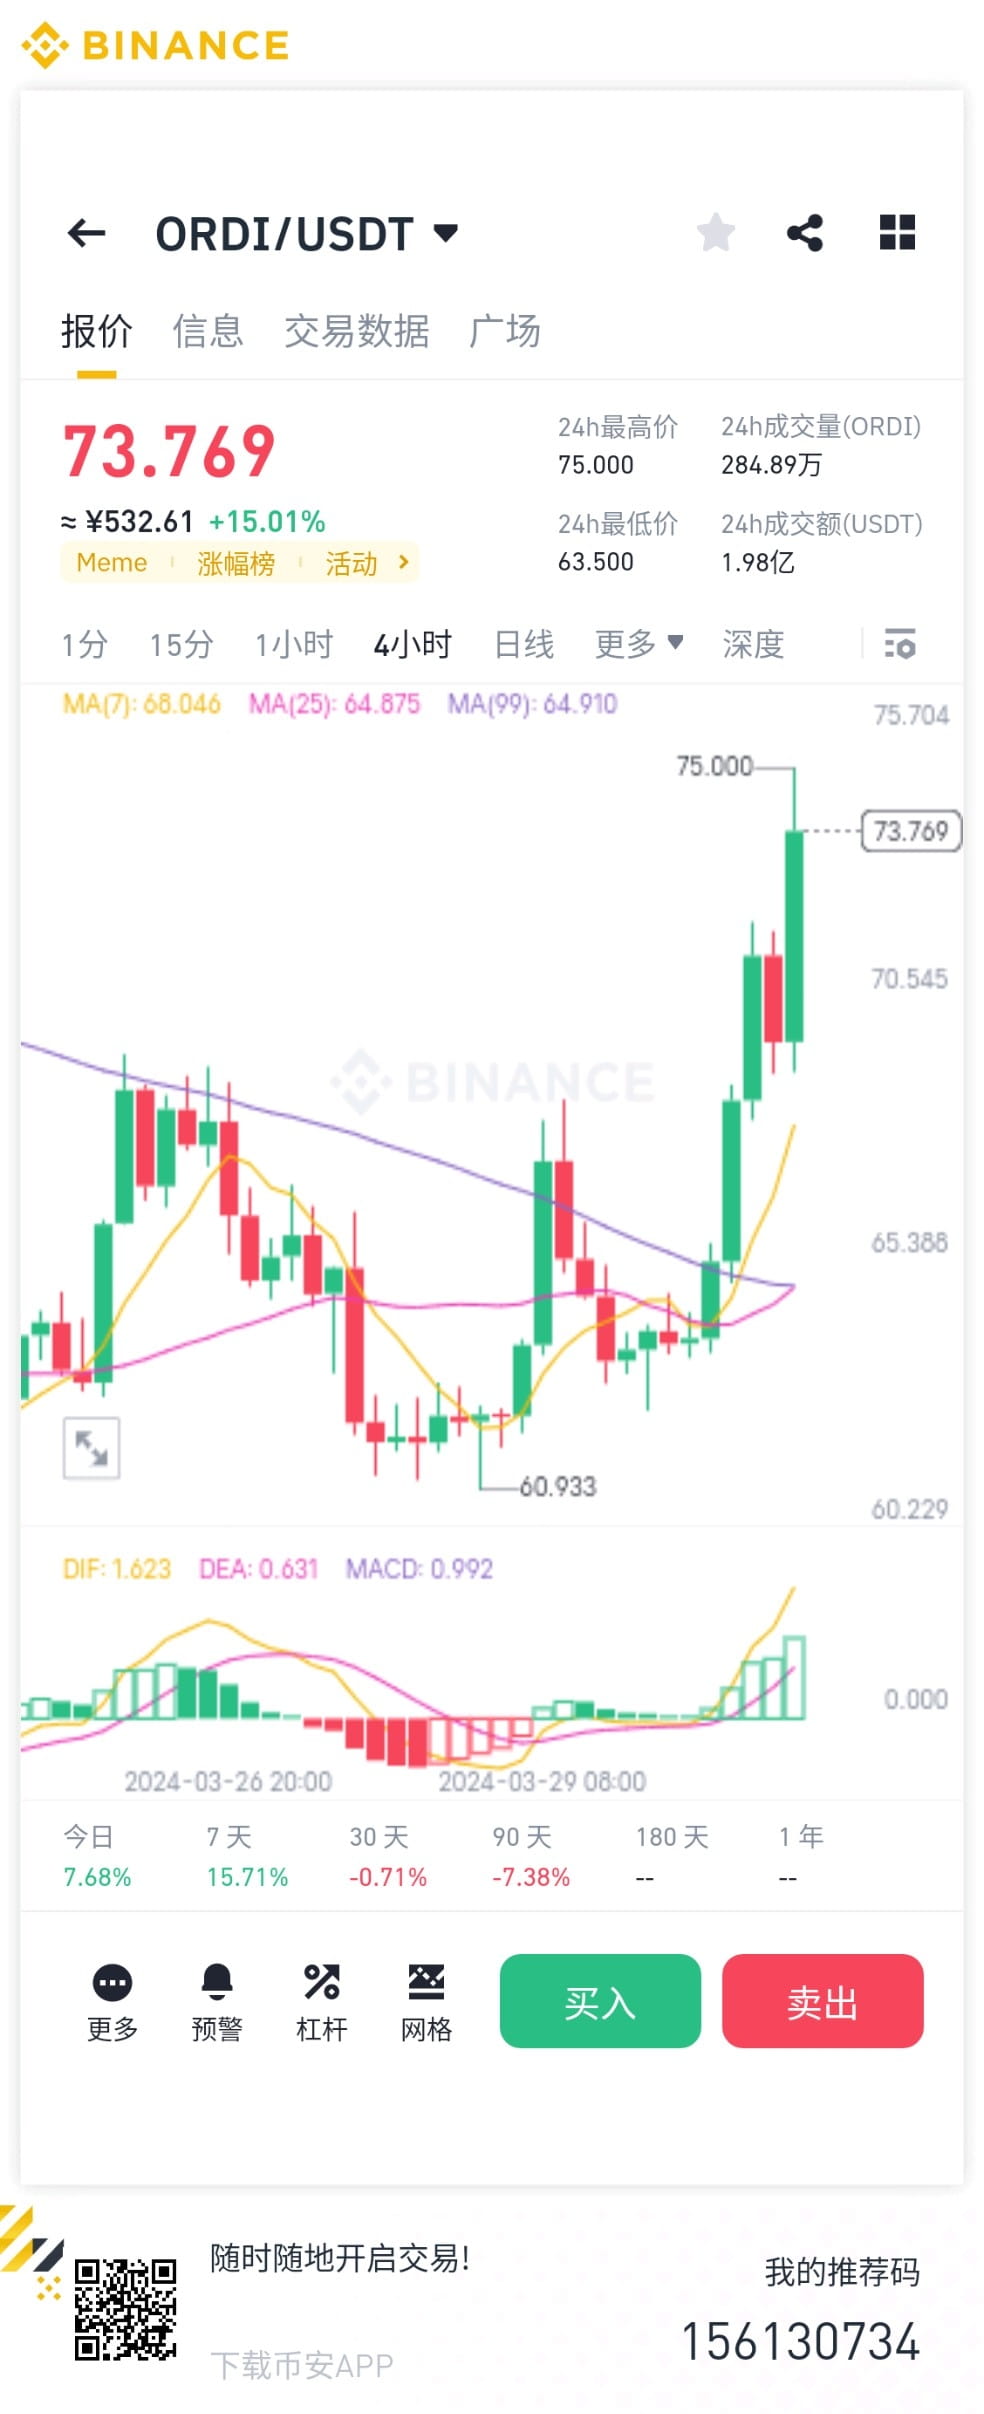
[ORDI buying and selling point analysis]
-Buying point one: 71.00USDT (EMA7 and EMA30 are golden crosses, and the price is running above EMA7, indicating that the short-term trend is improving)
-Buying point two: 69.50USDT (the low area of the recent 4-hour chart, if there is a callback, consider adding a position here)
-Stop loss point for long: 68.00USDT (below the recent support level and EMA30, reducing the risk of long)
-Selling point one: 75.00USDT (close to the previous high, may encounter resistance)
-Selling point two: 77.00USDT (recent high, if it breaks through, it will go higher, but go first to ensure profits)
-Short selling stop loss point: 78.00USDT (exceeding the selling point two, reducing short selling risk)
#铭文市场 #ORDIUSDT #btc减半了吗?
$ORDI
See original
[ORDI price trend analysis] 4-hour price trend: up
1.K line shape:
-The latest 4-hour K-line shows a larger entity and upper shadow line, indicating that buyers have the upper hand in the cycle but encounter some resistance.
-The daily level has closed positive for two consecutive days, and the latest positive line has a larger entity, indicating that bullish sentiment has strengthened in the short term.
2.Technical indicators:
-DIF and DEA in the MACD indicator are both positive, and the MACD histogram shows positive expansion, indicating that the current market is in a bullish trend.
-The J value in the KDJ indicator is higher than 100, which means it may be overbought, and you need to be alert to the risk of a correction.
-EMA7 has crossed EMA30 and diverged upwards, which is a sign of a bullish market.
3. Trading volume:
-The trading volume on the 4-hour chart amplifies when the price rises, indicating that the rise is supported by trading volume.
-On the daily level, trading volume has been relatively stable in recent days, with no abnormal fluctuations.
$ORDI
#大盘走势 #BTC #ordi。 #铭文市场

See original
【BCH Price Trend Analysis】4-hour price trend: sideways
1. K-line pattern:
-Recent daily K-lines show large price fluctuations. On March 29, a long upper shadow positive line appeared, indicating that although there was buying, the final closing price failed to remain near the highest point, and there may be selling pressure.
-In the 4-hour K-line, the K-line at 08:00 on March 30 was a negative line with a small body and a long lower shadow, suggesting that the price fell after the opening due to selling pressure.
2. Technical indicators:
-In the MACD indicator, DIF and DEA are both in the positive area, and the MACD histogram (6.63) is still positive, but it has decreased compared with the previous cycle, indicating that the bulls are weakening.
-The KDJ indicator J value (66.25) is lower than the K value (73.18) and D value (76.64), which may indicate that the trend is weakening in the short term.
-EMA7 (604.20) is above EMA30 (545.31), indicating that the short-term trend is upward relative to the long-term trend, but it is necessary to pay attention to whether EMA7 will turn downward.
3. Volume:
-Daily volume gradually decreased after reaching a peak on March 27, which may mean that market activity has declined.
-4-hour volume also fell after reaching an extremely high level at 16:00 on March 29. Combined with the sharp rise in prices at that time, it can be seen as a signal of active buyer intervention.
#BCH! #btc减半了吗? #大盘走势
$BCH
See original
【REI trend analysis】
1.K line shape:
-In the recent 4-hour period, the price has fallen sharply, the latest K-line entity is longer, and the closing price is close to the lowest price, indicating strong seller power.
-On the daily chart, the K line on March 29 is a long negative line, which shows that the price fell rapidly after the opening of the day and the buyer's momentum was insufficient.
2.Technical indicators:
-In the MACD indicator, DIF has turned from positive to negative, and the MACD column line has also turned from positive to negative, indicating that the market may weaken further in the short term.
-The J value of the KDJ indicator has entered the oversold zone in the 4-hour period, but there is still no sign of recovery, and there is no obvious reversal signal for the time being.
-EMA7 has penetrated EMA30 on the 4-hour period and diverged downwards, which is a short-term bearish signal.
3. Trading volume:
- Corresponding to the price decline, trading volume increased from March 28 to 29. Especially when the price dropped sharply, the trading volume was enlarged, indicating that this decline was accompanied by higher trading volume and stronger downward momentum.
-The trading volume has shrunk slightly in the latest cycles, but considering that the price is still at a low level, we need to be wary of whether there will be more selling in the future, which will lead to a further bottoming of the price.
$REI
Explore the lastest crypto news
⚡️ Be a part of the latests discussions in crypto
💬 Interact with your favorite creators
👍 Enjoy content that interests you
Email / Phone number
Trending Topics
bitcoin
21.2M views
5,785 Posts
🚨 Bitcoin Drops Below $62,000, Poised for a Major Rebound 🚨
1️⃣ Current Price Dip
Bitcoin has fallen below $62,000, causing concern among investors.
2️⃣ PlanB’s Analysis
PlanB, a renowned analyst, uses the stock-to-flow (S2F) model.
He highlights Bitcoin’s current price hovering around the five-month actual price of ~$65,000.
3️⃣ Significance of Actual Price in Bull Markets
Historically, Bitcoin rarely falls below its five-month actual price during bull markets.
This price level serves as a strong support line.
Bitcoin is expected to rebound from the $65,000 level.
4️⃣ Relative Strength Index (RSI)
RSI is a key momentum indicator to assess if an asset is overbought or oversold.
PlanB predicts that RSI values will align with peak levels from previous cycles.
This suggests exponential returns for Bitcoin.
5️⃣ Future Market Behavior
PlanB believes the current bull market will see exponential gains, not diminishing returns.
RSI values could rise above 80, similar to the cycles in 2013, 2017, and 2021.
📊 With Bitcoin’s current price around $61,785 and a slight decline of over 2% in the past 24 hours, the coming days will reveal if Bitcoin will recover as predicted. Historical trends provide a compelling case for an optimistic outlook.
📌 Stay tuned for more crypto insights! 👍
Disclaimer: This post is for informational purposes only and should not be considered financial advice.
#bitcoin #Binance
ORIONPLAY official
5 Likes
6.5k views
BTC
22.6M views
5,444 Posts
ETH
3.8M views
1,490 Posts


