Short-term no K strategy
1. Intraday short-term trend judgment method (ETFs)
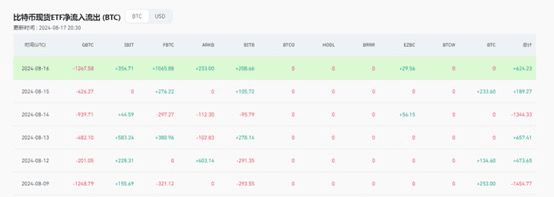
1. Institutional data distinguishes trends

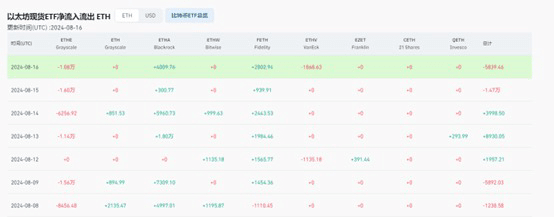
From the screenshot above, we can see that there was a net inflow on August 16th for Pie and a net outflow for Auntie. So today (August 17th) the trend is low-long. It is recommended to do Pie because the bulls of Pie are strong. You can also do Auntie, but the bulls of Auntie are weak and may not be better than Pie.
Note: If there are currencies that are strongly linked to Bitcoin, mainstream currencies, such as Prince or Sol, then you can do an additional short-term operation of the linked currency.
2. Data analysis trend of Dabingyitai institution
From the institutional data of Pie and Auntie: We only look at Pie in the market, not Auntie. Auntie is only for reference. The institutional holdings of Pie represent today's intraday trend, while Auntie only represents the strength of the market. So if there is a net inflow of Pie and a net outflow of Auntie, then refer to Pie data for low longs, and don't refer to Auntie.
2. How to determine the intraday trend point (liquidation map)
1. How to determine the point information for trending orders
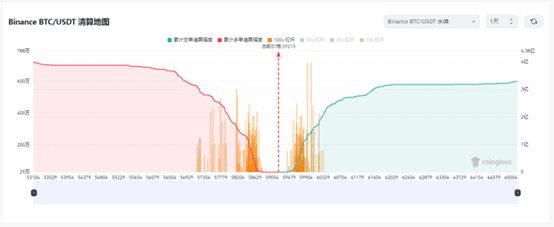
Use the liquidation map to find the entry point for trend-following operations: first determine the strength of the market's callback. Assuming that today's market callback is very weak, we will choose the position of the longest needle closest to the current price as the entry point. Then our exit point is the longest needle on the right side of the current price as the exit position (here we also need to judge the strength of the market rise). The selected price will be a little less than the price we see. For example, if the price we see is 57688, then the position we choose should be below this price, which is 57600 or 57630. . .
Note: The entry position should be chosen slightly above the current price, and the exit position should be chosen slightly below the current price (we should pay attention to judge the strength of the upward trend, and now the first and second longest pin entry positions). For the stop loss position, we will consider a little behind the pin position price behind the current entry price.
2. How to determine the point information for counter-trend orders
How do we use the liquidation map to make contrarian orders in 7 or 30 days?
How to choose a 7-day counter-trend order: the strength of the bulls. If you judge that the bulls are very weak, you should choose 7 days.
How to choose a 30-day counter-trend order: the strength of the bulls. If you judge that the bulls are very strong, you will choose 30 days.
Sometimes we can choose to use a combination of 1 and 7 days. What is the premise of this application? The market has been rising for several days and has been at a high level with signs of a breakthrough. Then we use 1 day to determine the final position of the high leverage, and then use 7 days to confirm the strong pressure position. The overlapping area is the position where we should consider entering the market against the trend.
There is no need to combine 30 days: it is generally used when the market has already skyrocketed and there is a spike or is about to be a spike, we will choose the 30-day market trend.
Note: 1 day is for trend-following orders in normal market, 7 days is for counter-trend orders in strong market, 30 days is for counter-trend bottom-picking or top-shorting orders in extreme market.


