After several delays, the time finally came last year: on September 15, 2022, developers initiated the Ethereum merge, transforming the second largest blockchain in the crypto space into a proof-of-stake chain. What is the current state of the Ethereum network?
1. Ethereum after the biggest upgrade in crypto history
With the Shapella upgrade in April this year, the switch to PoS was completed shortly after the merger. A lot has happened since then. Ethereum spot ETFs appear to have appeared for the first time, and futures ETFs are a foregone conclusion.
Furthermore, layer 2 networks continue to drive Ethereum’s scaling, which is why Coinbase and Binance already rely on them.A look at the numbers, data, and facts in the Ethereum ecosystem reveals the health of the network a year after the largest and most challenging upgrade in history.
 2. Ethereum price analysis
Bullish price targets: $1,759, $1,860, $1,937, $2,030, $2,141
Despite a 10% recovery in the last trading week of September, buyers have so far failed to recapture the 50-week moving average (EMA50) (orange) at $1,759. The strong start to the month was sold back to relevant support at $1,634 on the first regular trading day. Just below is the past 200-week moving average (EMA200) (blue) at $1,621, which must be defended to minimize the risk of price declines in the coming trading weeks.
However, only if Ethereum breaks out of the turquoise chart area with a weekly close, the chart will lighten up further and generate new upside potential to $1,860. If the buyers then manage to stabilize above this price level, the horizontal resistance of $1,937 will become a price target. This price level could not be broken by weekly closings in the past five trading months. If the price breaks through this resistance level on a sustained basis, the last high from July at $2,030 will be activated as a target. Currently, the yearly high around $2,141 is the biggest possible resistance area for the next four trading weeks.
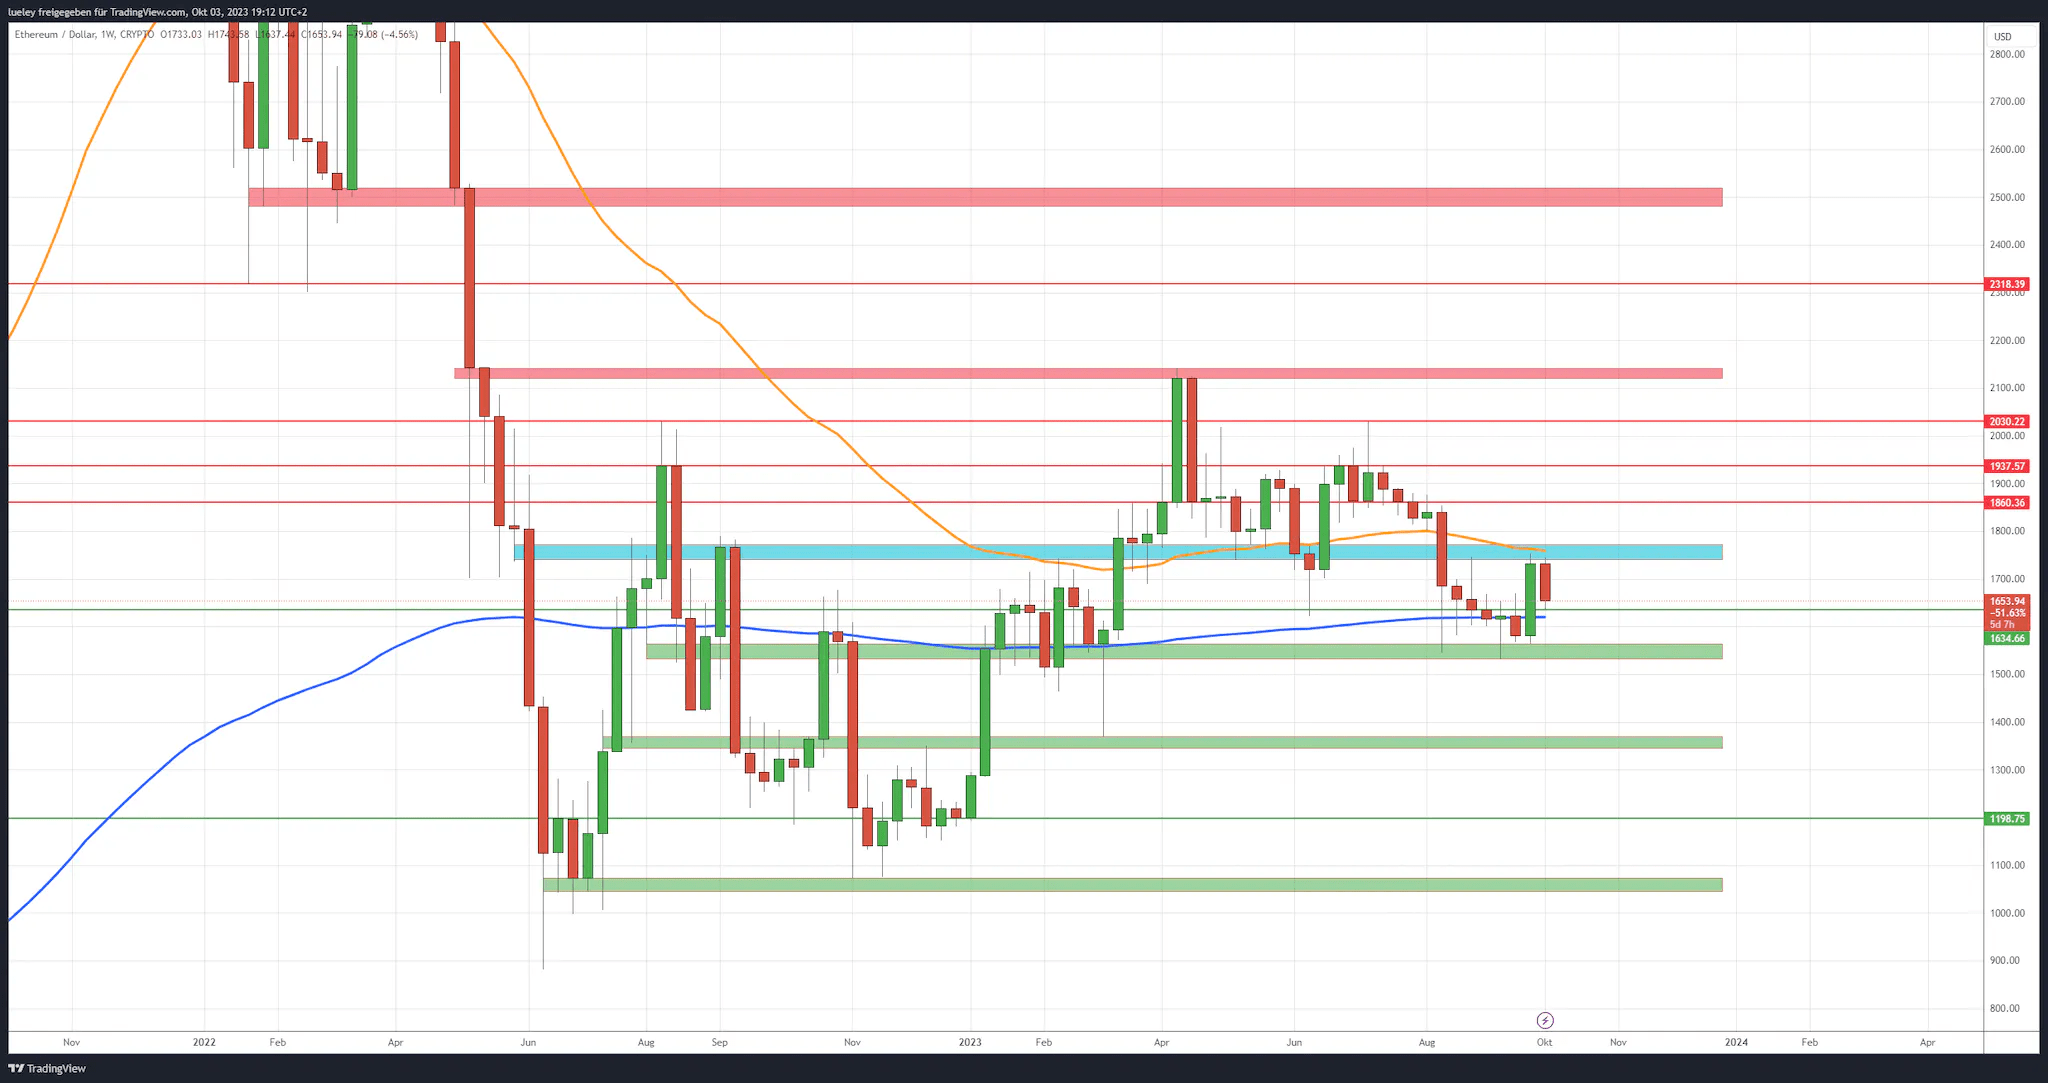
Bearish price targets: $1,621, $1,562, $1,371, $1,198
Despite the strong trading performance in October, if the Ether price falls back below the $1,621 area near the EMA200, an initial decision should be planned for the $1,562 area. If Ethereum actually leaves the area near the lows of the past few months with a weekly close, the chart will become very gloomy.
Therefore, the likelihood of a pullback extending to the area around the March low of $1,371 has significantly increased. If buyers also fail to achieve a turnaround in this area and Ethereum subsequently breaks out of the area around the last low on a sustained basis, the maximum bearish price target of $1,198 for the October trading month will come into focus.
3. Inflation rate: Ethereum is no longer deflationary
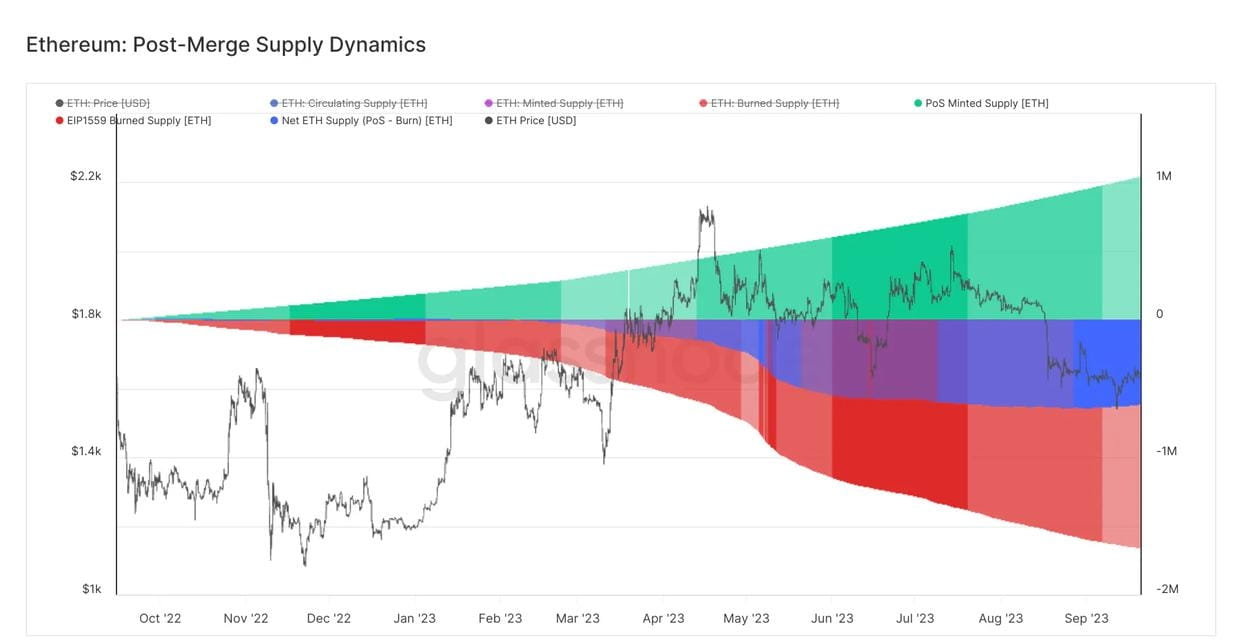
One of the strongest narratives around Ethereum is the idea of “ultrasonic money”, a deflationary supply dynamic since the EIP-1559 update. The function is simple: the more activity on the main chain, the more ETH is “burned”, i.e. removed from circulation over the long term. This causes the overall supply to shrink.
This inflation rate has been positive again since around mid-August, which indicates a drop in Ethereum activity and is indicative of the general situation during the summer doldrums. But if this bothers you, you should take a look at the chart below. Ethereum net supply has been negative since February, even after marginal inflation in the previous weeks. Even a short break obviously won't change anything.
4. Pledge rate: continued upward trend
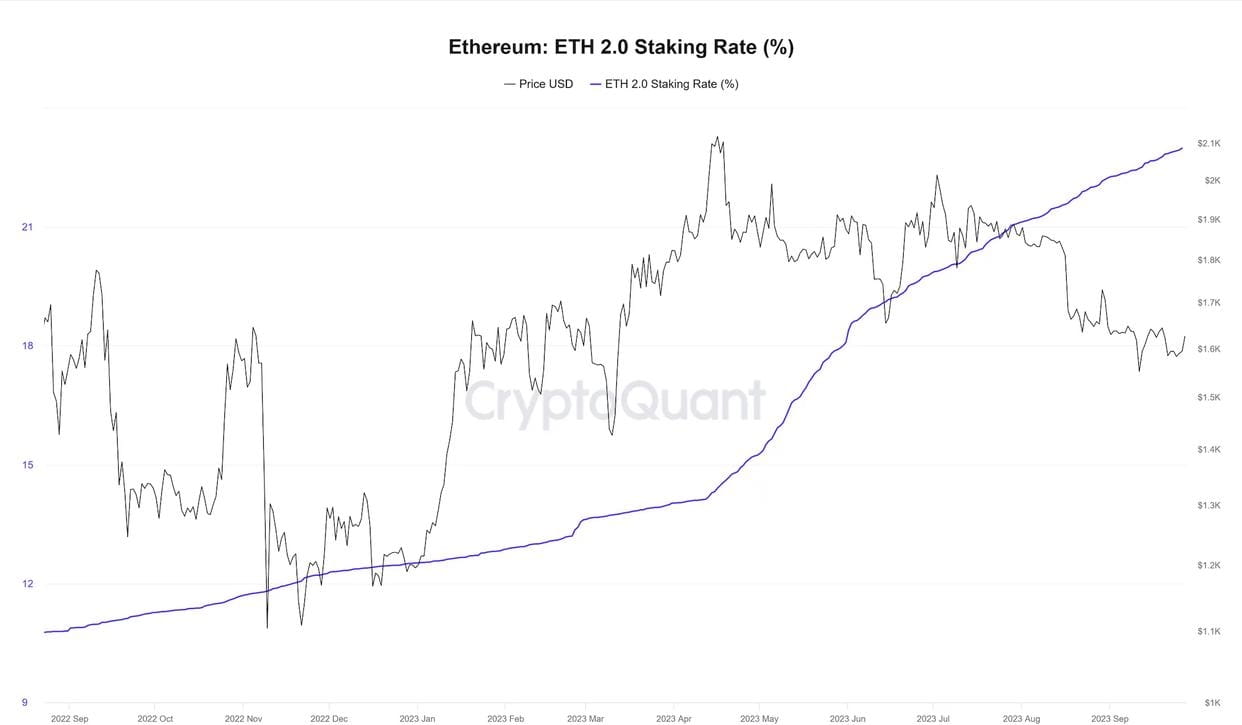
The staking rate represents the percentage of the ETH supply that is currently staked. As shown in the chart, the staking rate is on a continuous upward trend. This means that more and more ETH holders are contributing their cryptocurrency to secure the network. Depending on the provider, they are currently receiving an average return of 4.4%.
However, compared to other blockchains, such as Cardano (ADA), Solana (SOL) or Polkadot (DOT), the staking rate still lags significantly, as usually more than 50% of the tokens are staked there. So there is still a lot of room for improvement. For the total supply of Ethereum, this also means: the more staked, the fewer tokens there are in circulation.
5. Lido: Dangerously high stakes ratio?
As shown in the chart below, Lido is (still) the dominant provider of Ethereum staking. Not much has changed since the merger, even though there are now many so-called competitors.
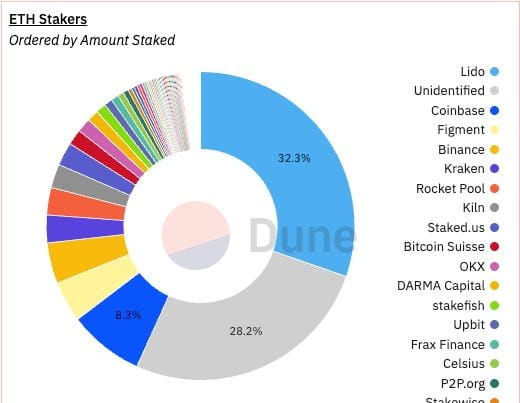
The protocol currently hosts 32% of all ETH tokens, which could pose a growing centralization risk to Ethereum. However, with new innovations such as Distributed Validator Technology (DVT), this trend could soon change.
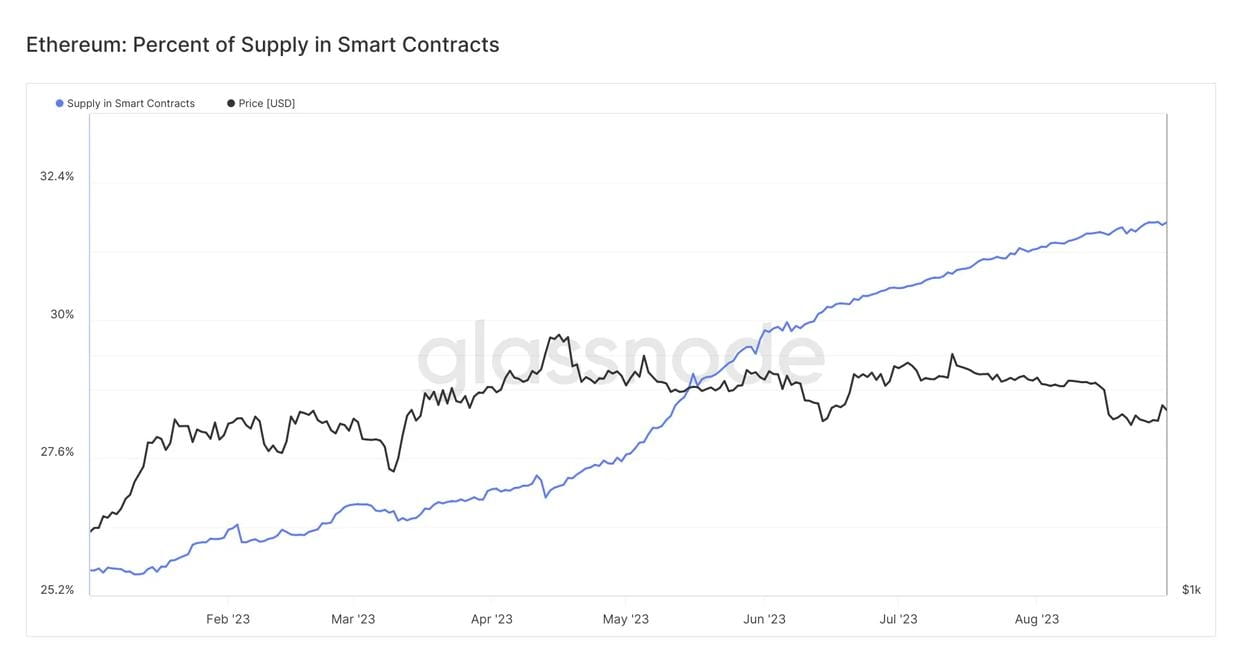
6. Increase in the amount of ETH in smart contracts
To fully understand the supply dynamics of Ethereum, not only the Ether available on centralized cryptocurrency exchanges, but also the staking or inflation rate is crucial. In particular, the number of tokens locked in smart contracts is very significant. It consists of all the ETH in smart contracts and staking in various decentralized applications on Ethereum.
So the idea is the same: the more tokens are used (locked) in smart contracts, the fewer tokens there are in circulation and this will lead to a further shortage of supply on top of the already declining number of ETH tokens on exchanges. If demand remains the same or increases, this could lead to higher prices in the long run.
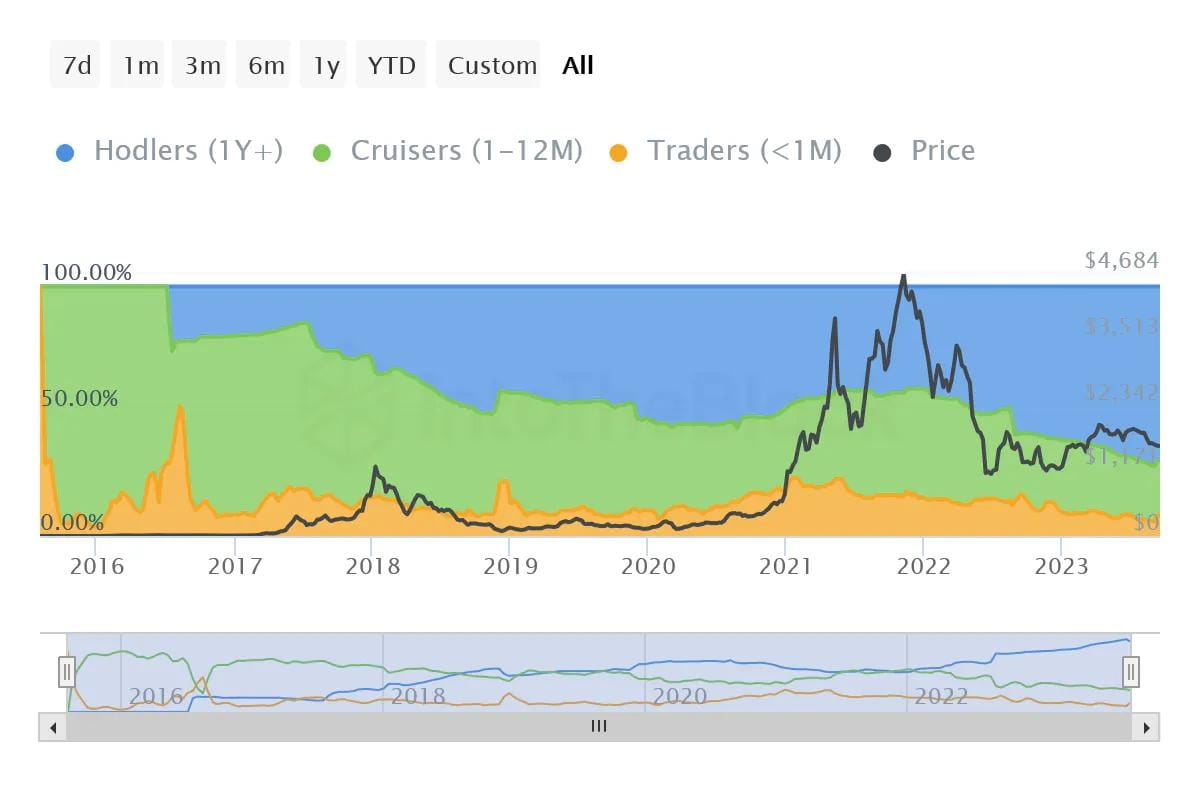
7. Long-term ETH investors are holding their tokens
Now let's look at the development and behavior of Ethereum holders/users and whales. The following graph shows who holds how many tokens and for how long. Interesting in this regard is the blue group (Hodlers): entities that have held tokens for more than a year. It is clear that the proportion of this group has increased significantly since the merger. Or to put it simply: the amount of Ether held by holders is constantly increasing.
This is a very typical development in the late bear market. As a result, crypto tourists have disappeared - as can be seen from the decline in the share of traders (yellow) and entities that have held crypto for less than a year (green). In the long run, what remains are convinced users who will not sell the product, but continue to grow and create a solid demand base.
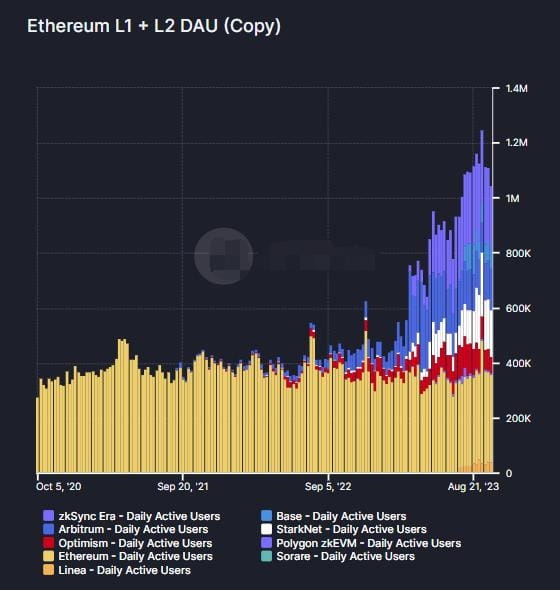
8. Number of ETH ecosystem users: 1 million daily active users
The number of users on a blockchain provides information about activity and popularity, which is probably one of the most important indicators of the health of the network. On the Ethereum mainchain (yellow), this value has remained stable since the merge. From the chart, it is clear that the number of users on the Ethereum Layer 2 network has increased significantly.
It’s easy to imagine that low fees and faster processing speeds, combined with Ethereum’s already popular Dapps, could draw users away from alternative layer 1 networks. In September, the blockchain reached a new milestone: more than 1 million daily users on both layer 1 and layer 2 chains.
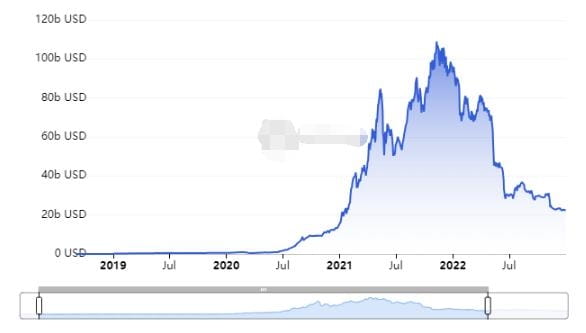
9. DeFi: Total Value Locked (TVL) is Weakening
However, neither mergers nor an increase in the number of users seem to have a lasting impact on the total locked value (TVL) in the Ethereum DeFi space. Liquidity on the Ethereum blockchain has been on a downward trend since mid-April this year, and recently broke through the previous low in December 2023. The reasons are obvious: on the one hand, the macroeconomic environment is suppressing new capital inflows into the cryptocurrency sector. On the other hand, a large amount of liquidity is flowing from the main chain to the growing Layer 2 field. More on this later.
Staking protocol Lido Finance holds the largest share of Ethereum TVL at over 50%. Lido is followed by big names like Maker, Aave, and Uniswap. Lido’s dominance shows that the DeFi niche of staking and liquidity staking token finance (LSTfi) is currently dictating events on the Ethereum mainchain. More sophisticated DeFi applications are increasingly turning to L2, such as Arbitrum and Optimism.