Tonette Ranta hriU
@Square-Creator-ace423f54ef8
Following
Followers
Liked
Shared
See original
If it was a week ago, when the volume and amplitude had shrunk into this range, I would have gone all in without hesitation, but now I just want to slap myself. $SHIB
See original
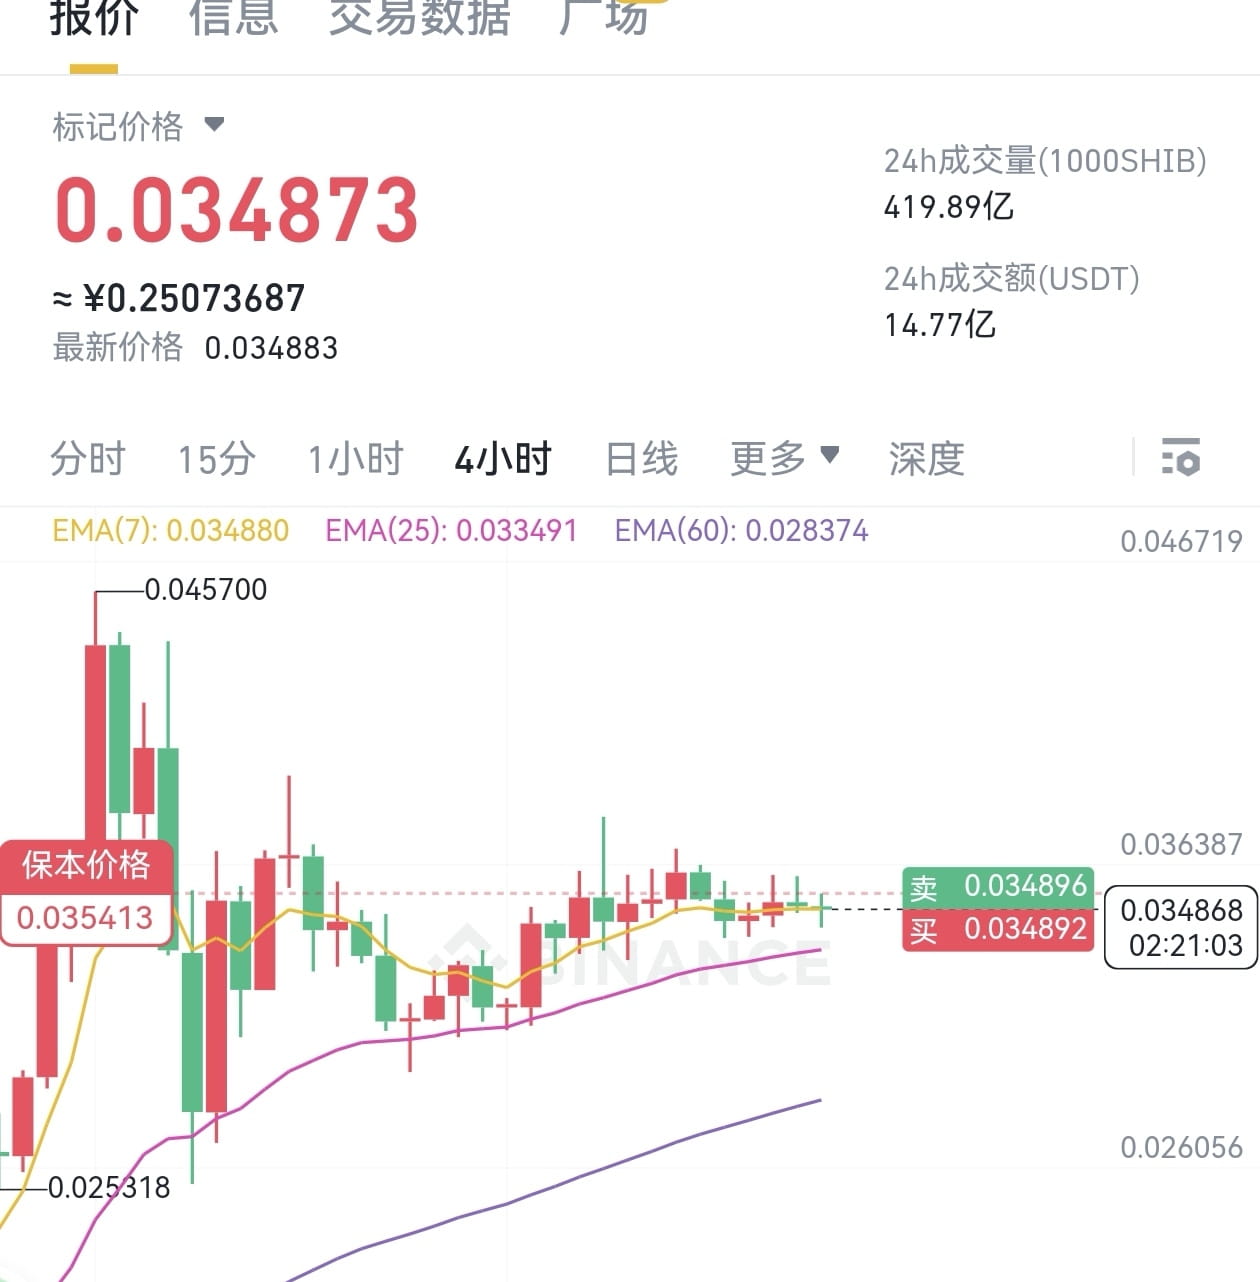
This market situation confused me. I entered the market at 0.033, took half the profit at 0.037, and cleared the position when it fell back to 0.035. When #SHIB/𝗨𝗦𝗗𝗧 fell to 0.0338, I chose to go short because I thought it was about to fall below the trend. But I didn't expect that 0.0338 happened to be the lowest level. After that, it started to rebound and fluctuated around 0.0345. It is currently suffering a floating loss of 2000u. There have been two cross stars and a downward probe on the one-hour K-line, which has a bottom-up trend, but the market's bearish sentiment is strong, which makes me hesitate to stop the loss. The technical aspect has been broken many times, and I kind of want to cut the flesh and leave.

See original
If it breaks through 0.038, it is technically judged that it will rise to 0.0395 and then fall back to 0.036. Of course, such a prediction is too rigid and cannot be guaranteed 100%. Please note that please reduce the behavior of making profits through swings. Although this behavior of picking up the banker's wool will allow you to obtain a small part of the profit in a short period of time, more people doing swings will affect the development of the general trend, and it itself has a higher risk. Hold on to the chips in your hand. I covered part of my position at 0.33. I will stop profit when it rises to 0.40 and wait for the next entry opportunity. #SHIB/𝗨𝗦𝗗𝗧
Tonette Ranta hriU
--
Bullish
$SHIB
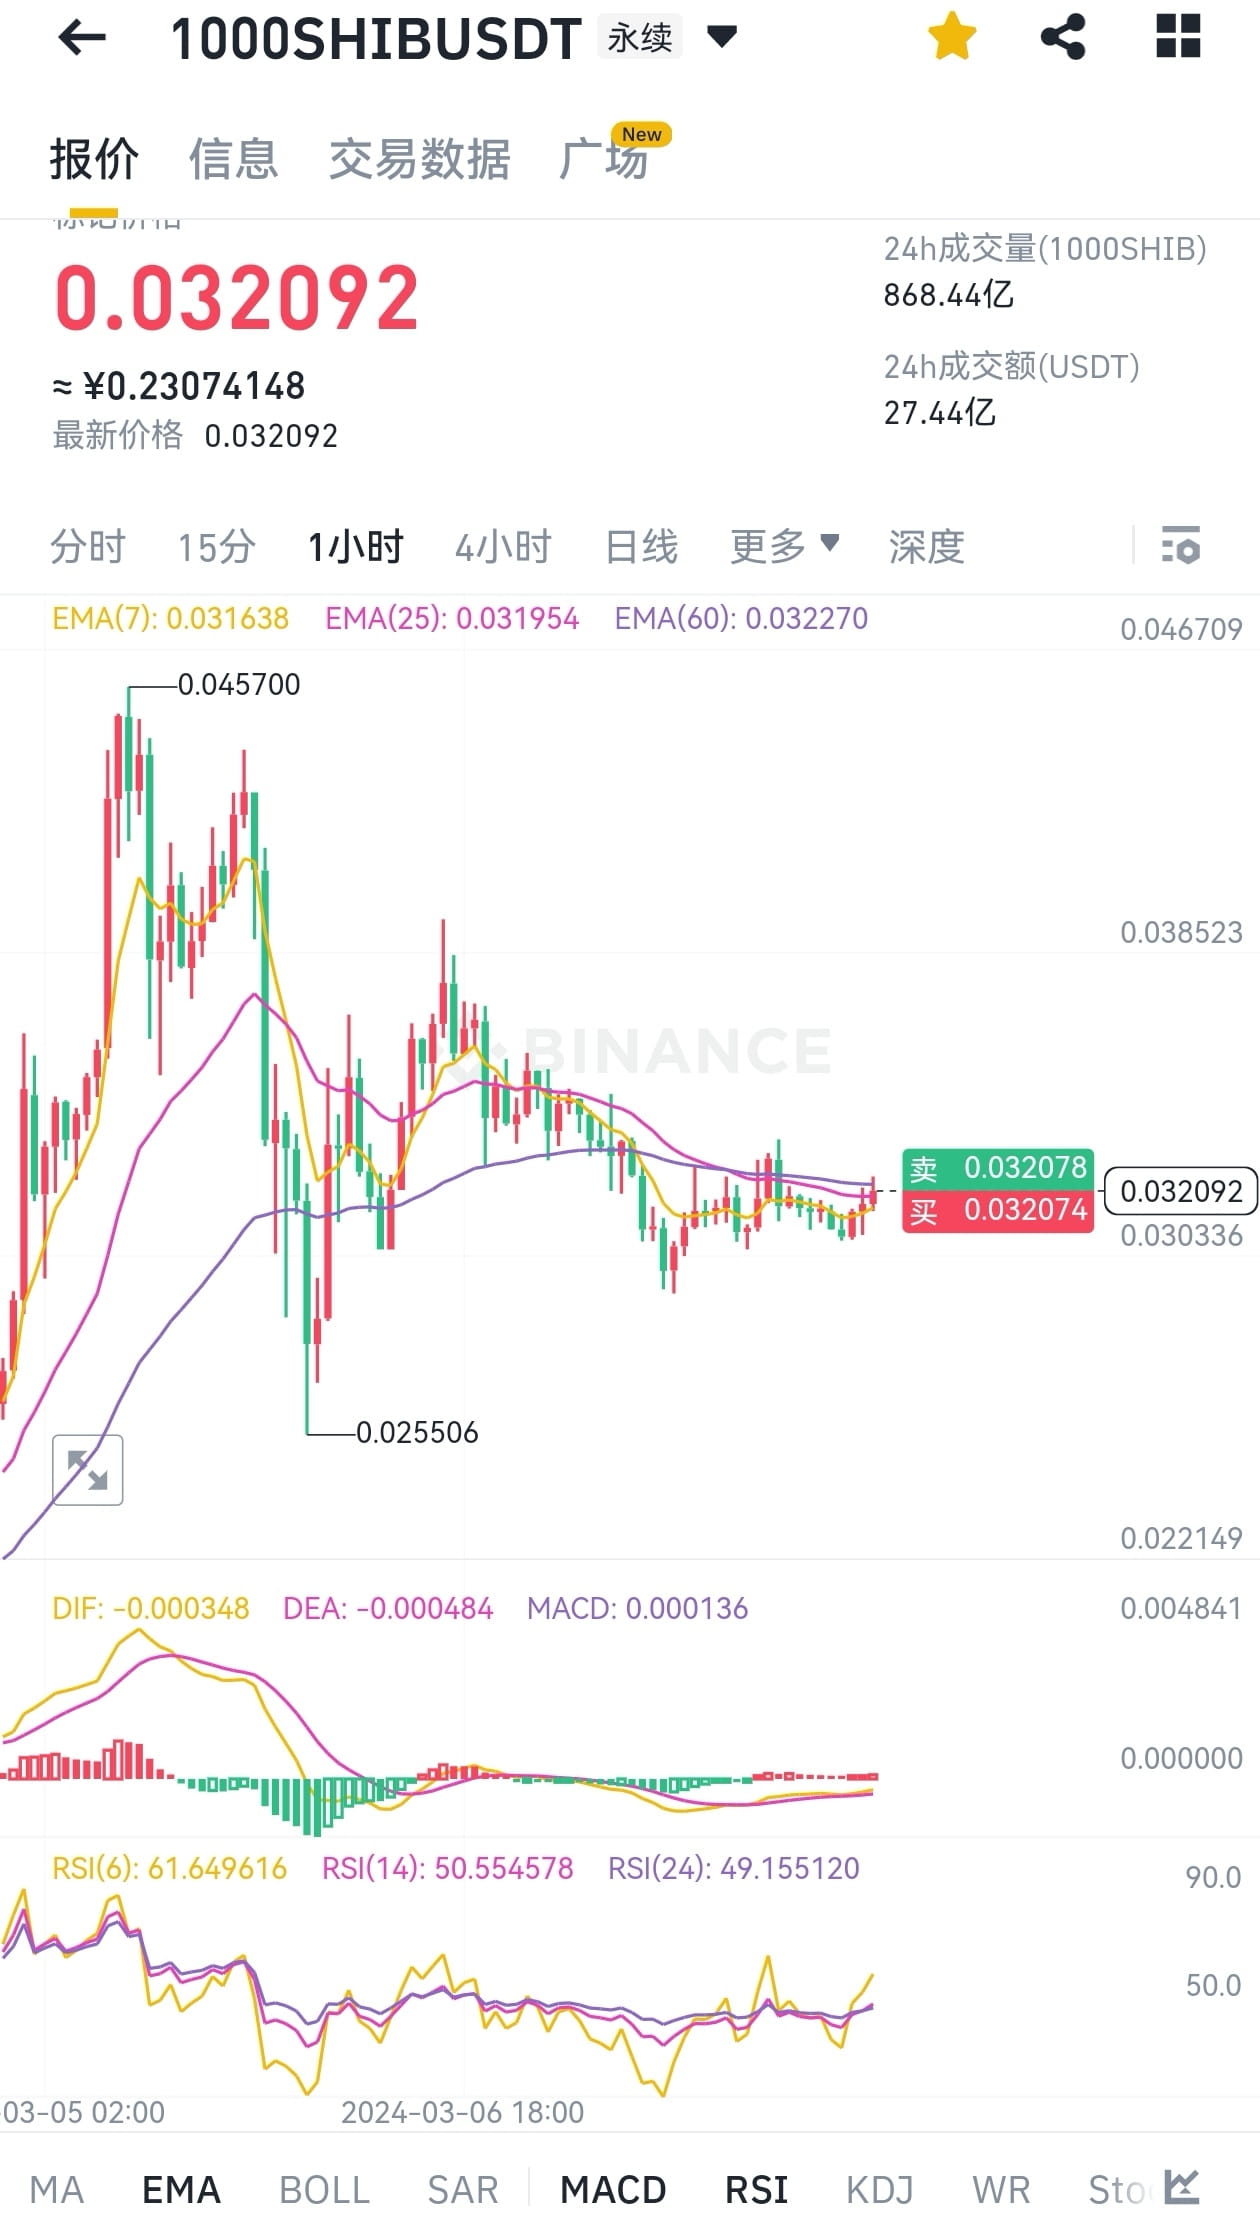
From a technical analysis alone, #SHIB/𝗨𝗦𝗗𝗧 has not fallen below the trend. I am personally bullish. Of course, this analysis does not take into account the impact of market sentiment and other mainstream currencies. To be on the safe side, you can choose to sell if it falls below 0.33 again.
From a technical analysis alone, #SHIB/𝗨𝗦𝗗𝗧 has not fallen below the trend. I am personally bullish. Of course, this analysis does not take into account the impact of market sentiment and other mainstream currencies. To be on the safe side, you can choose to sell if it falls below 0.33 again.

See original
$SHIB
From a technical analysis alone, #SHIB/𝗨𝗦𝗗𝗧 has not fallen below the trend. I am personally bullish. Of course, this analysis does not take into account the impact of market sentiment and other mainstream currencies. To be on the safe side, you can choose to sell if it falls below 0.33 again.
From a technical analysis alone, #SHIB/𝗨𝗦𝗗𝗧 has not fallen below the trend. I am personally bullish. Of course, this analysis does not take into account the impact of market sentiment and other mainstream currencies. To be on the safe side, you can choose to sell if it falls below 0.33 again.
See original
Through technical analysis, a symmetrical triangle has emerged. Observe whether it will exceed the trend. If it rises above 0.33, then 0.31 is regarded as the support level. If it falls below 0.30, 0.31 is regarded as the resistance level. Note: You can hold the spot spot, but do not open a contract position easily unless there is other reliable information to help you analyze it. #SHIB/𝗨𝗦𝗗𝗧
See original
As you can see, looking at the daily K-line or the 4-hour and 1-hour K-line, it shows that someone is stabilizing the price to attract funds? Or a sell-off. The long-short ratio of large households has reached a terrifying 4.82. I personally think it will once again retreat to the 0.22 position before stretching, but it would not be surprising if it climbs directly upward now.
In addition, through comparison, its rise and fall trend is highly correlated with sats in the 5% range, but sats rises higher than rats every time#1000rats #ratsusdt If you have a different view, you can share it
In addition, through comparison, its rise and fall trend is highly correlated with sats in the 5% range, but sats rises higher than rats every time#1000rats #ratsusdt If you have a different view, you can share it


Explore the latest crypto news
⚡️ Be a part of the latests discussions in crypto
💬 Interact with your favorite creators
👍 Enjoy content that interests you
Email / Phone number
Trending Topics
Token2049
17.4M views
8,045 Posts
The Fed meeting is today, ,
At the moment, the expectations are as follows:
⚫ ~64% - the rate will be reduced by 0.50%.
⚫ ~36% — the rate will be reduced by 0.25%.
Unexpectedly, the market expects a 0.50% decline, which is not fully priced in. Therefore, such a move by the Fed could trigger a short-term rise in the market. But 0.25%, given market expectations, could, on the contrary, lead to a short-term decline.
At the same time, former head of BitMEX Arthur Hayes said from the stage of Token2049 that the Fed will collapse the market by lowering the key interest rate.
What are your expectations?
The rate will be reduced by 0.25% —🔥
The rate will be reduced by 0.50% — 👍
Pause / raise —😱
#FOMC #BinanceLaunchpoolHMSTR #Token2049 #NeiroOnBinance #USRetailSalesRise
cryptoogeek
28 Likes
35.5k views
FOMC
23,958 views
22 Posts
BinanceLaunchpoolHMSTR
28.4M views
11,269 Posts


