1. Current price
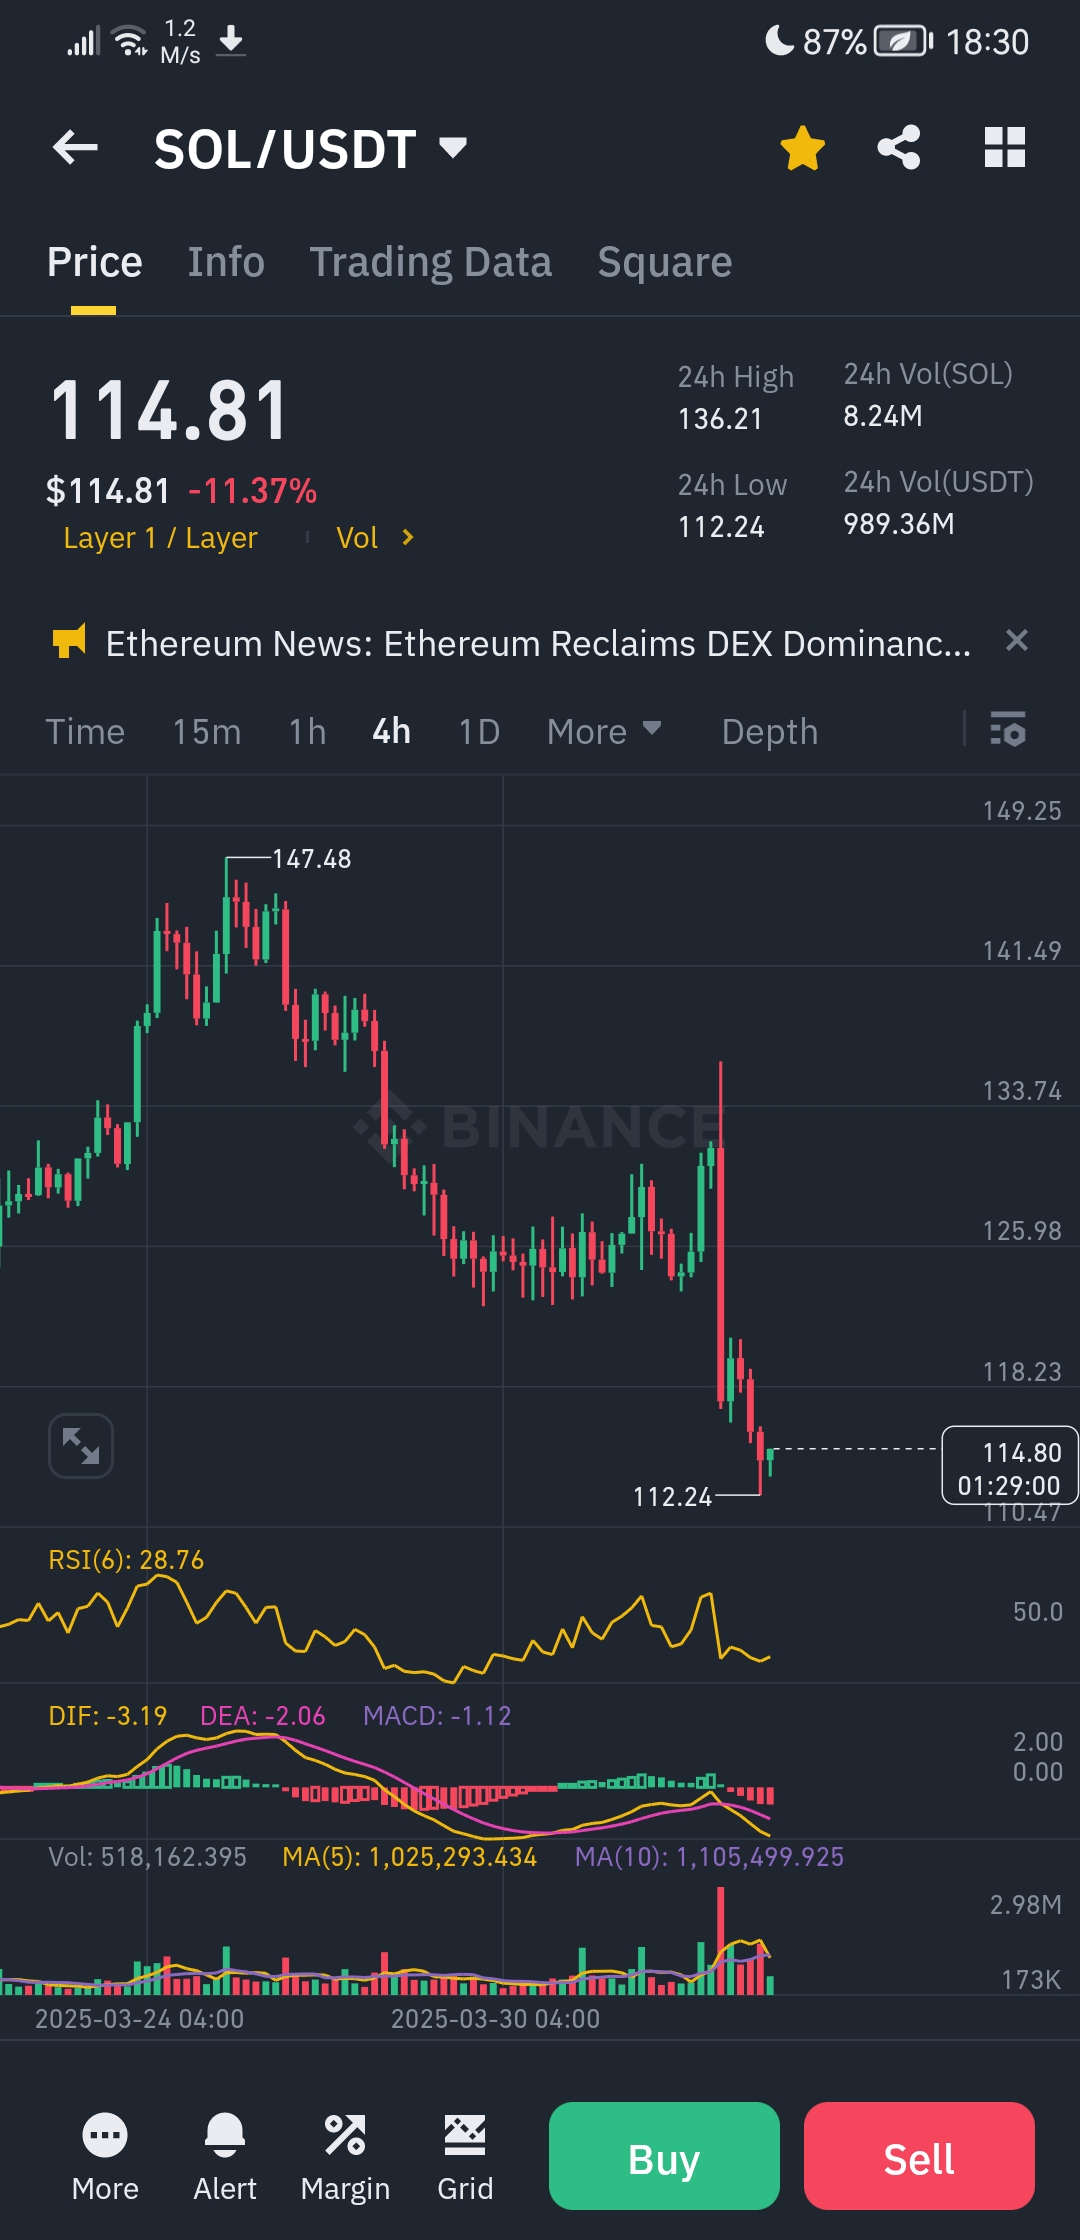
Current price: 114.81 USDT
Daily change percentage: -11.37% (sharp decline indicating strong selling pressure)
2. Important levels
Highest price in 24 hours: 136.21 USDT
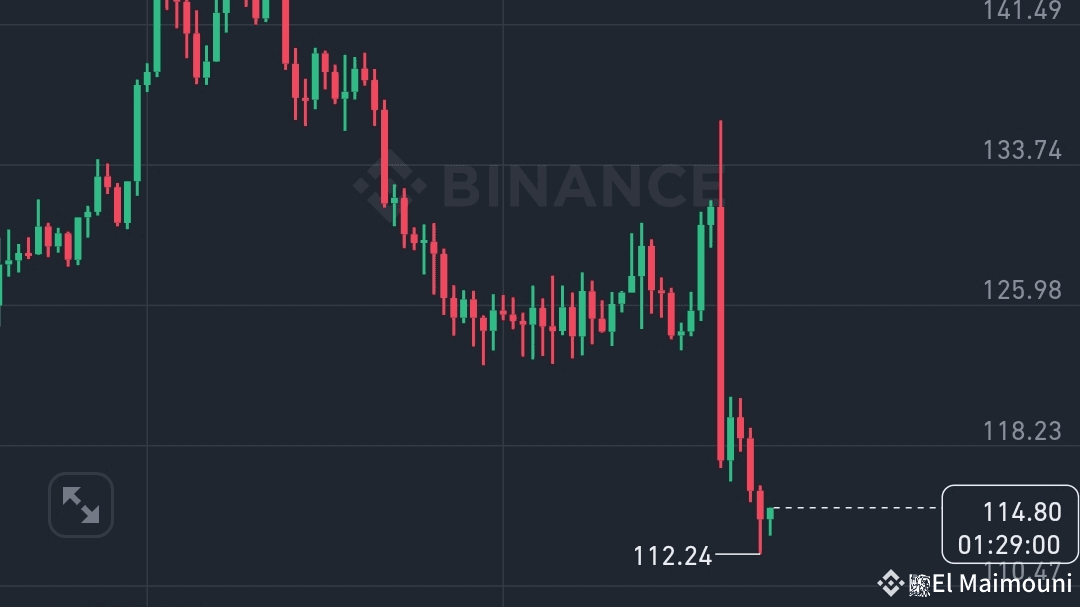
Lowest price in 24 hours: 112.24 USDT
The current price is close to the daily low, indicating a possibility of a rebound or continued decline if support is broken.
3. Technical indicators
RSI (6) = 28.76 → in the oversold area, which may lead to a bullish rebound soon.
MACD = -1.12 → negative signal, indicating weakness in bullish momentum.
DIF (-3.19) and DEA (-2.06) → the bearish crossover between them confirms the continuation of the downtrend.
4. Trading volume
Trading volume in 24 hours:
SOL: 8.24 million
USDT: 989.36 million
Increased trading volume with a price decline indicates intense selling, which may lead to further declines if selling pressure continues.
5. Chart and candles
The bearish trend started from the peak of 147.48 USDT and has seen a strong decline.
The price broke the support level of 118.23 USDT, leading to an acceleration of the decline.
---
Forecasts and strategies
Bullish scenario (Positive)
If the price rebounds from the 112-114 USDT area, we may see an upward movement towards the resistance of 118-125 USDT.
RSI in the oversold area supports the possibility of a rebound.
Bearish scenario (Negative - Continuation of the decline)
If the price breaks the 112 USDT level, the decline may extend towards 110-105 USDT.
The current bearish trend is still strong, supported by the bearish MACD.

Recommendation
For short-term traders: Monitor the 112 USDT level; if it stabilizes above it, look for short-term rebound opportunities.
For long-term investors: Wait for confirmation of the rebound before entering a buying position, or wait for stronger support levels.
Summary: The price is in a strong downward trend, but the oversold condition may lead to a temporary rebound. It is preferable to wait for a reversal signal before making a new buying decision.