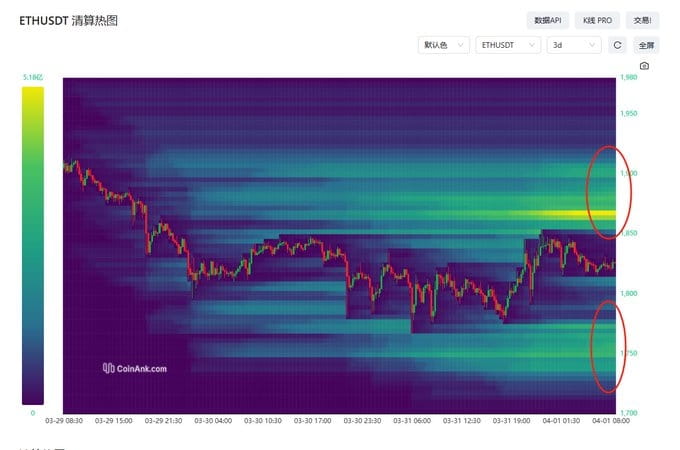
The monthly line shows a trend of four consecutive declines, and there will be a continuation of the decline this month, followed by a decent rebound. The target will be near the monthly MA30 line, which is around 2370-2540.
The trading volume has been relatively high over the past four months. Who is selling? Who is buying?
The monthly MA30 line shows a flattening pattern after an upward movement, and the MACD shows an increasing downward momentum near the zero axis.
The decline in the monthly line has started to slow down, and the price has reached the upper edge of the wide fluctuation range from February 2023 to October 2023. If the price continues to drop, it will reach the lower edge of this range, which is the 1600-1500 area, where there will be strong support, making it a good entry point.
The monthly line cannot directly reverse upwards in a V shape; after a rebound, it will still need to go through a period of consolidation. A solid base must be built for better upward movement, with the consolidation lasting at least two to three months, or up to five to six months.
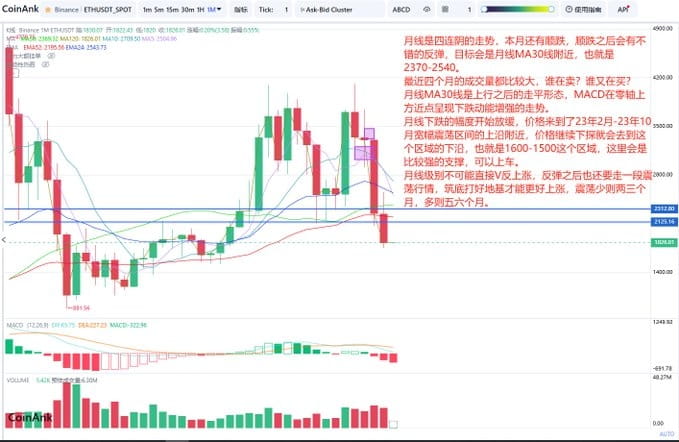
The daily line shows another candlestick pattern resembling a doji, with a larger range of fluctuations, and the trading volume has increased by one-third compared to the previous day, indicating that market funds are starting to show activity.
The daily MA30 line is still in a downward trend, and the MACD shows weakening upward momentum not far below the zero axis, with the fast and slow lines about to cross downwards. The daily line's six consecutive declines have ended. If the MACD crosses down, the daily line will continue to seek a bottom, and the 1500 area mentioned in the weekly and monthly lines will be a short-term bottom position. If the daily line closes with a bullish candlestick, the MACD does not cross down, and the price quickly rebounds after reaching a new low, then an invisible divergence pattern will occur, leading to a rebound at the daily line level towards the 2120-2320 area, followed by another daily line level decline.
How exactly it will go will be known in the next couple of days; observe more and act less.
Daily level resistance at 1930-2010-2120-2200-2320, support at 1700-1630-1550
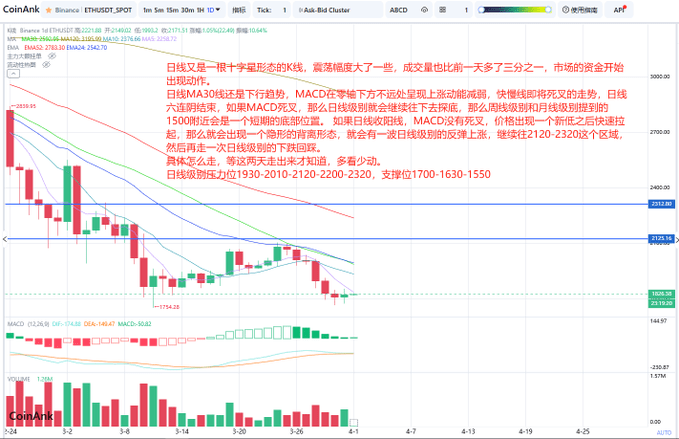
From the liquidation heatmap data of Ethereum, it can be seen that
the price is rising, with a large number of large and extra-large short positions waiting for liquidation in the 1850-1920 area.
The price is falling, with a small number of large long positions waiting for liquidation around 1810, and a large number of large and extra-large long positions waiting for liquidation in the 1780-1728 area.