
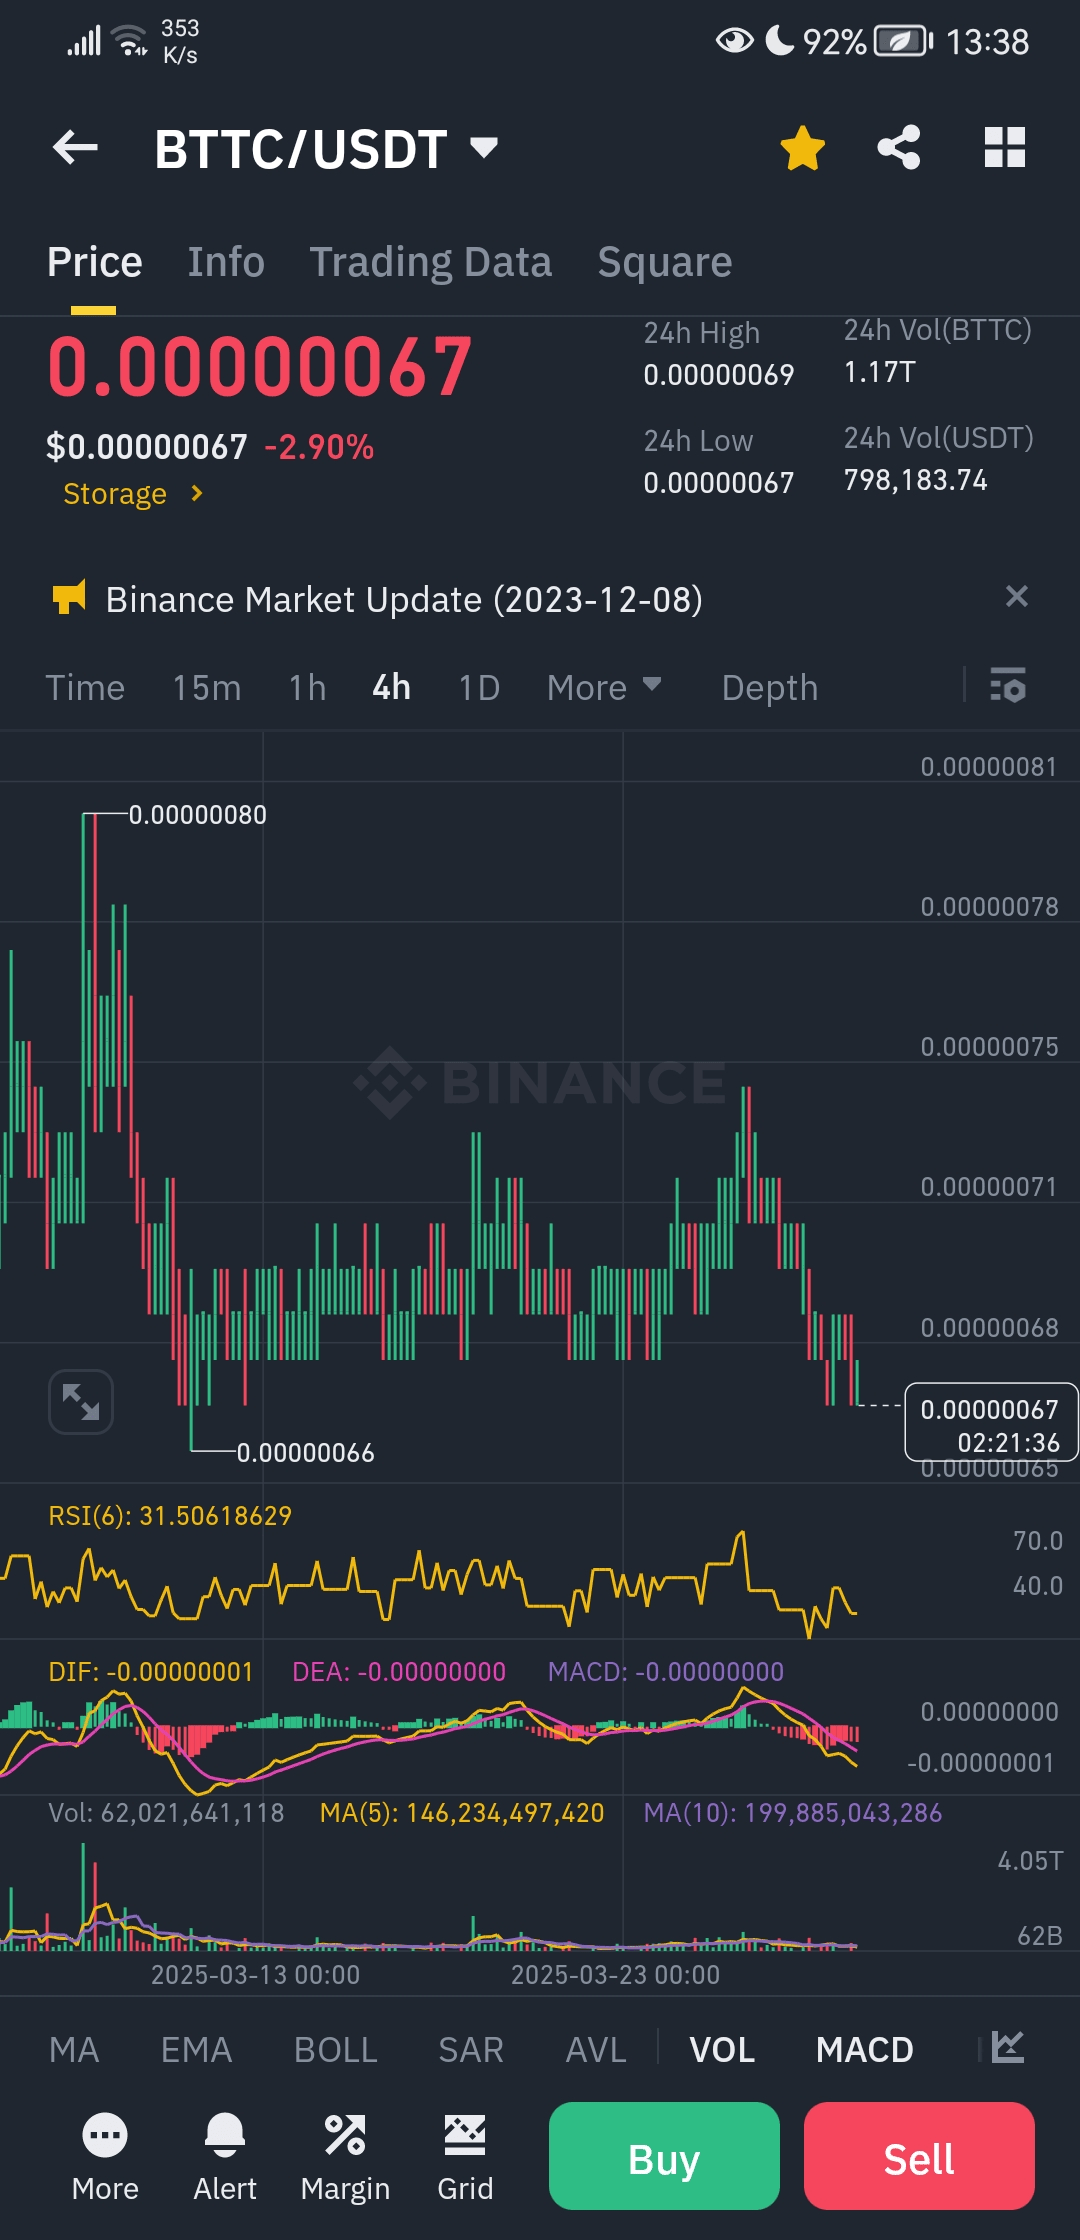
🔹 Current price: 0.00000067 USDT (-2.90%)
🔹 Highest price in 24 hours: 0.00000069
🔹 Lowest price in 24 hours: 0.00000067
---
📌 Entry area:
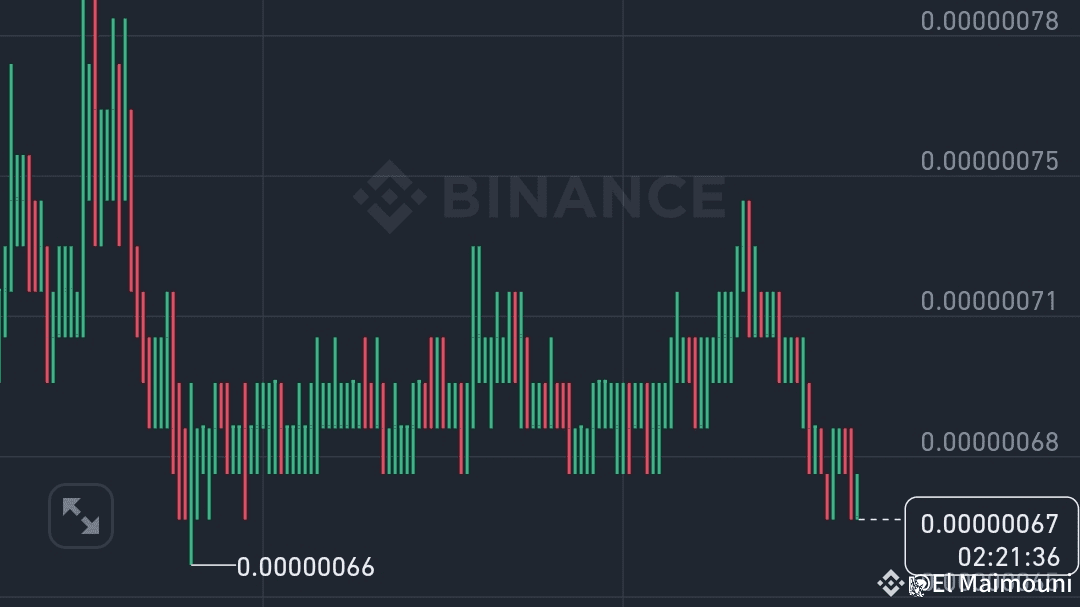
🔹 0.00000066 - 0.00000067
🎯 Targets:
✅ Target 1: 0.00000070
✅ Target 2: 0.00000075
✅ Target 3: 0.00000080
🛑 Stop loss:
🔻 0.00000065
---
📊 Technical analysis:
🔸 BTTC faces strong support at 0.00000066 - 0.00000067, an area that could see a rebound if buyers intervene.
🔸 Relative Strength Index (RSI = 31.50) indicates a close approach to the oversold area, which may mean a near rebound.
🔸 MACD shows slight bearish momentum, but if a bullish crossover occurs, it may signal the start of a price recovery.
🔸 Trading volume is high (1.17T BTTC in the last 24 hours), indicating interest in the current price.
💡 Confirmation of upward movement: A clear break above 0.00000070 could strengthen the rise towards 0.00000075 - 0.00000080 in the coming days.
---
📢 Risk management:
✔️ Take profits at each target to ensure gains, moving the stop loss to the entry point after hitting the first target.
✔️ Staying above 0.00000066 supports a rebound, while breaking 0.00000065 may indicate further decline.
📈 Do you see a good opportunity in this move? Share your opinion in the comments! 🔥
---
🛠 General tips:
🔹 Monitor technical indicators like RSI and MACD to accurately determine entry and exit points.
🔹 Maintain risk management by setting a stop loss and sticking to it.
🔹 Do not trade on emotion, markets are volatile, and it is essential to have a clear plan.