
Brothers, did you all make a big profit last night?
The Federal Reserve's interest rate decision at two o'clock this morning has truly attracted everyone's attention! Although everyone knew that there would be no interest rate cut this month, the remarks from the Federal Reserve are still very much in focus because these remarks can reflect the future pace of interest rate cuts.
As expected, the Federal Reserve's decision early this morning maintained the benchmark interest rate unchanged, without a rate cut, but hinted at two interest rate cuts this year, expected to total 50 basis points, with another 50 basis points cut in 2026. This hint is like a reassuring pill for the market. A Fed rate cut means the dollar weakens, which means more liquidity in the capital market, leading to rising asset prices.
In addition, the Federal Reserve also announced that it will start to slow down the pace of balance sheet reduction on April 1. What does this mean? Many brothers do not understand, so let me explain it to everyone.
First, let’s talk about the expansion of the balance sheet. Balance sheet expansion means the Federal Reserve will increase the total assets and liabilities, which means the Federal Reserve will purchase more U.S. Treasury bonds and mortgage-backed securities, thereby providing more currency and liquidity to the market. Conversely, balance sheet reduction is the opposite; the Federal Reserve will reduce the total assets and liabilities, selling U.S. Treasury bonds and mortgage-backed securities to withdraw dollars and reduce market liquidity. To put it plainly, it’s like when you’re driving and feel the speed is too fast and might lose control, you will hit the brakes.
So what does a slowdown in the balance sheet reduction mean? Simply put, when you first start to brake, you stomp on the pedal, and the car speed reduces very quickly, or you think the speed is about to drop to a reasonable range. At this point, you slowly lift your foot off the brake pedal. The speed is still decreasing, but it’s not decreasing as quickly, and soon you might completely release the brake pedal or even step on the gas again.
The capital market is always speculating on expectations. These two dovish policies have created a strong bullish expectation in the market, so the market saw a broad rise last night.
Additionally, there has been a significant outflow of BTC and ETH from the mainnet and on-chain exchanges from yesterday to now, which is also a very good phenomenon.

In fact, regarding market expectations, can we not grasp it just because we don’t look at the conclusions of these policies? Of course not.
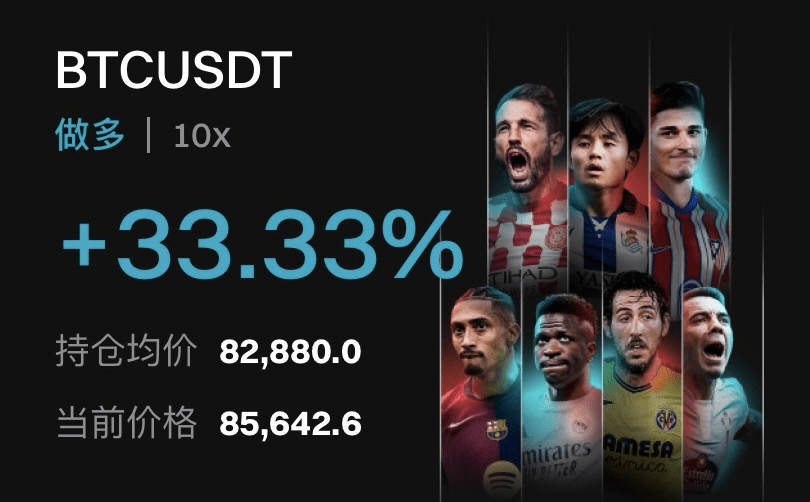
From a technical analysis perspective, yesterday around noon, the 30M moving average turned bullish again, with the price standing above the moving average, forming a second bullish position. Plus, the 4-hour moving average is still in a bullish trend, which is definitely a 4-30 double position model. Not taking action would be disrespectful to the devil trading system. So, yesterday I re-entered long around 82900 and exited this morning before hitting the peak, a bit early and conservative, but still okay.
So how will things evolve later?
First, let’s confirm one point: the weekly review last weekend stated that there would be a drop in the first half of the week and an increase in the second half. This main tone has not changed; it's just that the decline in the first half of the week was too weak.
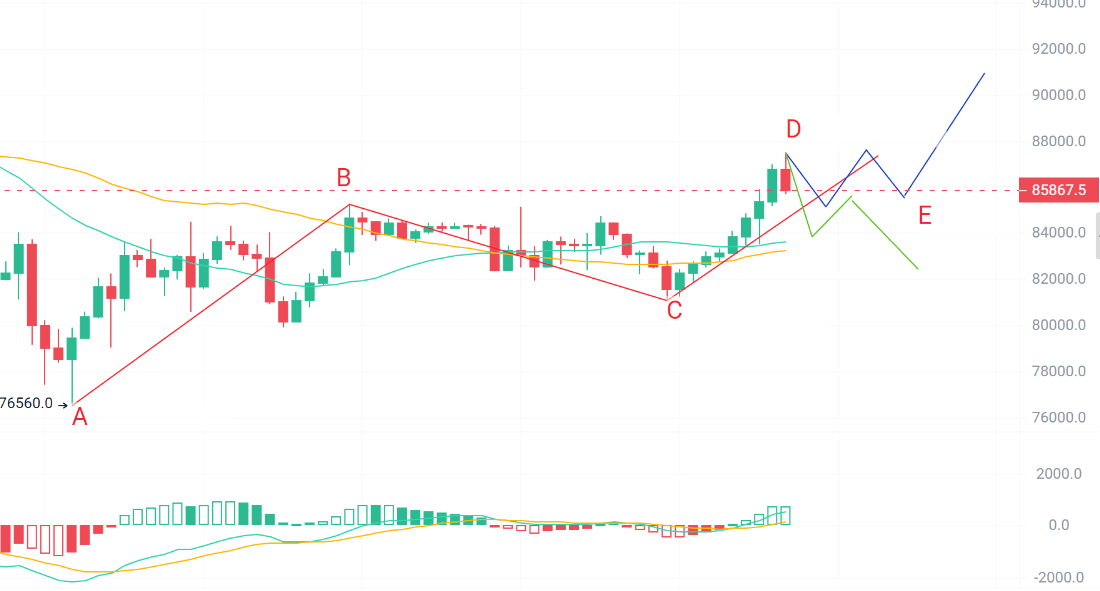
This decline is just from B to C, and then it starts to rise. It’s hard to see this as a wave of decline in terms of shape, but structurally, B-C is a downtrend, and the rise from C to D is just a smaller increase than the levels of AB and BC, which means the rise that started at C is not over. The focus from today to tomorrow should be on two points:
First, when will the CD end? From the 30M chart, this wave of increase is not confirmed to be over, and it can completely go up a bit more before turning. However, internally, there is now a third center. The more centers there are, the closer we are to a turning point. The probability of a direct turn here is quite high.
Second, what is the pattern of the pullback after D? After D, the 4-hour chart shows double pullbacks to E. If E is higher than point B, then it’s definitely a daily level buying point, which will continue to be bullish. If E is lower than B, we can still go long, but from point B onward, it will still be a large-scale consolidation, and we should treat long positions as a range.
The situation is gradually becoming clear. Do you understand it?