Bitcoin (BTC) Technical Analysis – March 19, 2025
Market Overview:
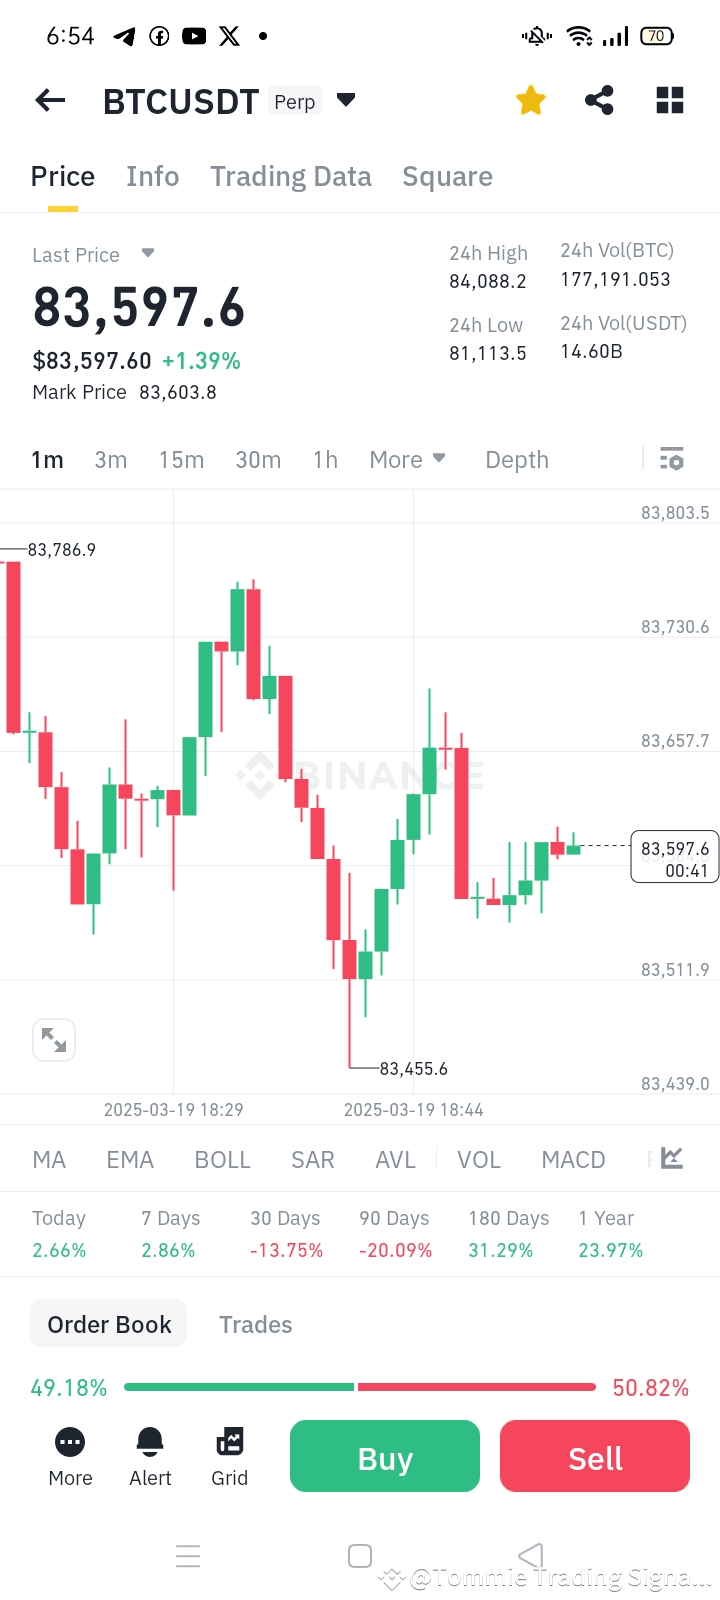
Last Price: $83,597 (+1.39%)
24H High: $84,088
24H Low: $81,113
24H Volume: 177,191 BTC
Technical Indicators Analysis:
1. Moving Averages (MA & EMA):
Short-term (5-10 MA): BTC is slightly above the short-term moving averages, indicating minor bullish momentum.
Mid-term (20-50 MA): Uptrend remains intact but needs confirmation above resistance.
Long-term (100-200 MA): BTC is still bullish in the long-term unless support breaks
2. Bollinger Bands:
BTC is near the middle band, meaning price consolidation.
If it moves toward the upper band ($84,500-$85,000), expect further bullish momentum.
If BTC falls to the lower band ($82,500-$82,000), a short-term correction is possible.
3. MACD (Momentum Indicator):
MACD Line and Signal Line are converging, indicating a potential breakout soon.
If MACD crosses bullish, BTC may push toward $85,000+.
4. RSI (Relative Strength Index):
RSI is around 55-60, meaning BTC is in neutral-to-bullish territory.
If RSI moves above 65-70, it could signal an overbought condition and a possible pullback.
5. Volume Analysis:
Buy orders are increasing, but sell orders are slightly dominant (50.82%).
Needs a volume surge for a clear bullish breakout.
Key Levels to Watch:
Resistance Levels:
$83,800 - $84,100 → Immediate resistance (needs a breakout).
$85,000 → Strong resistance zone; BTC must break this for further upside.
$86,500 - $88,000 → Next bullish targets if momentum holds.
Support Levels:
$83,500 - $83,300 → Immediate support level.
$82,500 - $82,000 → Major support zone; a breakdown could lead to more downside.
$81,000 - $80,500 → Critical support level; breaking this may cause a bearish trend.
Retest Zone:
BTC could retest $83,500 before confirming direction.
If BTC holds above $83,500, a bullish move is likely.
Trade Setup & Price Prediction:
Bullish Scenario (If BTC Holds Above $83,500):
Entry Price: $83,500 - $83,700
Target: $84,500 → $85,000 → $86,500
Stop-Loss: Below $82,800
Confirmation: If volume increases and MACD turns bullish.
Bearish Scenario (If BTC Breaks Below $83,500):
Entry Price: $83,300 - $83,500 (Short Sell)
Target: $82,500 → $81,500 → $80,500
Stop-Loss: Above $84,100
Confirmation: Weak volume, MACD bearish crossover, and RSI dropping.
Final Decision – Best Trade Option:
✅ Best Option: Buy/Long if BTC stays above $83,500.
If BTC breaks above $84,100, expect a move to $85,000+.
If BTC breaks below $83,500, a short-term pullback to $82,500 is possible.
 BTCUSDTPerp65,296.4-1.10%