

As of 9:30 this morning, Bitcoin closed with a positive line this week, opening at 80688 and currently at 84140, up 3452 points. Overall, it has recovered the losses on Monday, but the decline on Monday was a continuation of the sharp drop last week. The rebound in the following six days was just a correction of the sharp drop last week. The correction was not strong and only recovered 50% of the decline.
Last week's accelerated decline occurred on Sunday. In addition to market factors, the main reason was Trump's rhetoric. On March 10, Trump refused to rule out the possibility that the U.S. economy could enter a recession this year in an interview with the "Sunday Morning Future" program, saying that the U.S. economy is entering a "transition period." Trump also said that his comprehensive tariff policy could cause "short-term pain" for Americans.
This statement directly caused Bitcoin to drop by nearly 10% in two days. There was no particularly important news in the market in the following days, and the CPI and initial jobless claims data did not have much impact on the market.
From a fundamental perspective, there has been no substantial positive news after Trump’s remarks this week. The market is just a technical rebound after extreme panic. Therefore, the current fundamentals are not sufficient to support Bitcoin’s mid-line bottoming out. If there is no major positive news next week, the market may continue to fall after the technical rebound.
From the perspective of technical analysis, the internal reference on the 11th mentioned that at the close of February, the monthly top pattern was formed and the closing price fell below the May line. Therefore, the beginning of January was a decline on the monthly chart. This decline will take at least 3-5 months of volatility before it can be confirmed that the bottom has been reached. It is only the second month now, which means that there are still one and a half to four months of consolidation to come. This means that before that, don’t guess the bottom in the medium term and can only operate in the short term.
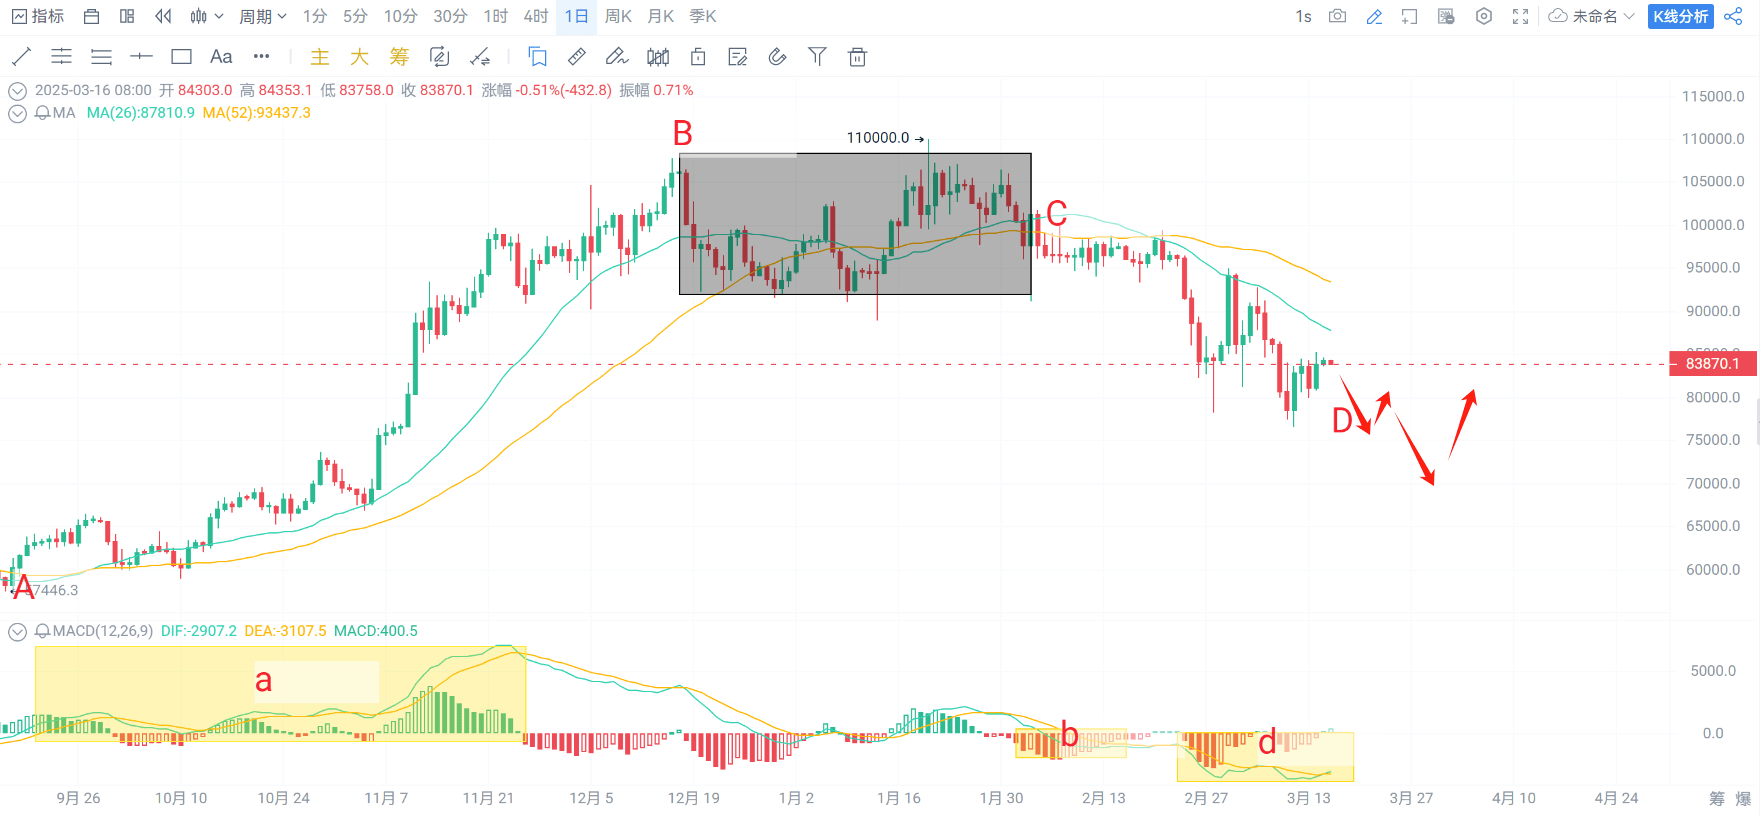
On the daily chart, we look at it point by point. The most important thing at present is the formation of the black shadow part of B-C, which is a weekly level expansion center. C-D has not yet been completed. If it is completed, we want to know whether D will rebound and pull back to the position of C, which is the black shadow part above. We can compare the strength of CD and AB. If the strength of CD is less than that of AB, then it will pull back to C, that is, back to 100,000 again. If the strength of CD is strong, then we will not see 100,000 for a long time in the future.
At present, I personally tend to believe that CD is less powerful than AB, and the price will return to more than 100,000 in the future. Because from the graphical point of view, the power corresponding to CD is the sum of the two yellow shaded areas of MACD below, that is, b+d, and the MACD corresponding to the power of AB is the yellow shaded area a. Now it is visible to the naked eye that b+d<a, that is, at present, CD is less powerful than AB, AB is back to the shadow, and CD will definitely return to the black shadow position.
It’s just that CD has not been completed yet, and the rebound this week is only 50% of last week’s decline. The daily moving average is under short pressure, and there is a high probability that there will be a second decline next week, and the force will be strong. Because compared within the CD segment, the area of d is larger than that of b, so the rebound this week is also weak.
It is expected that there will be a sharp drop in the first half of next week and a rebound in the second half. This rhythm must be grasped well. Do not chase highs today and tomorrow. Short sell first when the rebound is weak and leave the market after the sharp drop. Do not bottom buy unless it breaks 76560. If you grasp this rhythm well, you will not lose money.
The situation with ether is similar, only weaker.
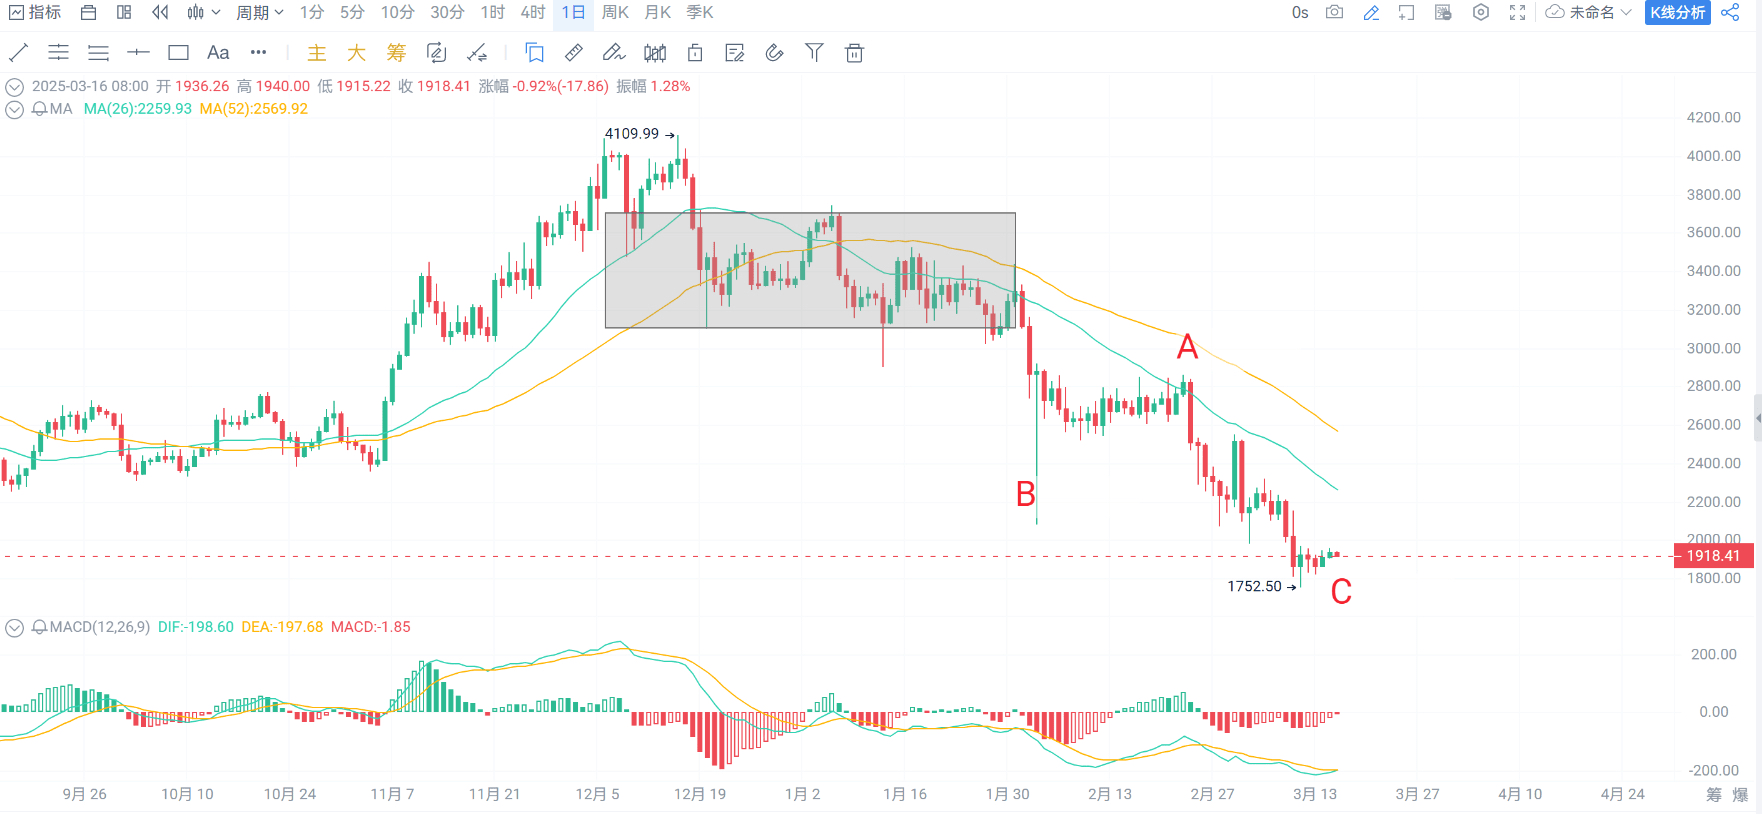
The gray shadow is the weekly center. B-A did not pull back the shadow, forming a weekly selling point. After that, AC is a daily downward trend, which has not been completed yet. Let's continue to look for new lows next week.
There will be another Fed meeting next week, and the expectation is that the interest rate will remain unchanged. I personally think the result should also remain unchanged. On the one hand, the CPI has fallen by 0.1 percentage points recently, so there is no possibility of raising interest rates. On the other hand, Powell has repeatedly stated in the past month that there will be no interest rate cuts for the time being, so it is expected that the interest rate will remain unchanged next week. Now this expectation has been digested. Unless there is a surprise next week, it will continue to run according to the original trend.
The weekly report is a classification of the overall rhythm, not an operational suggestion, so please refer to it with caution.