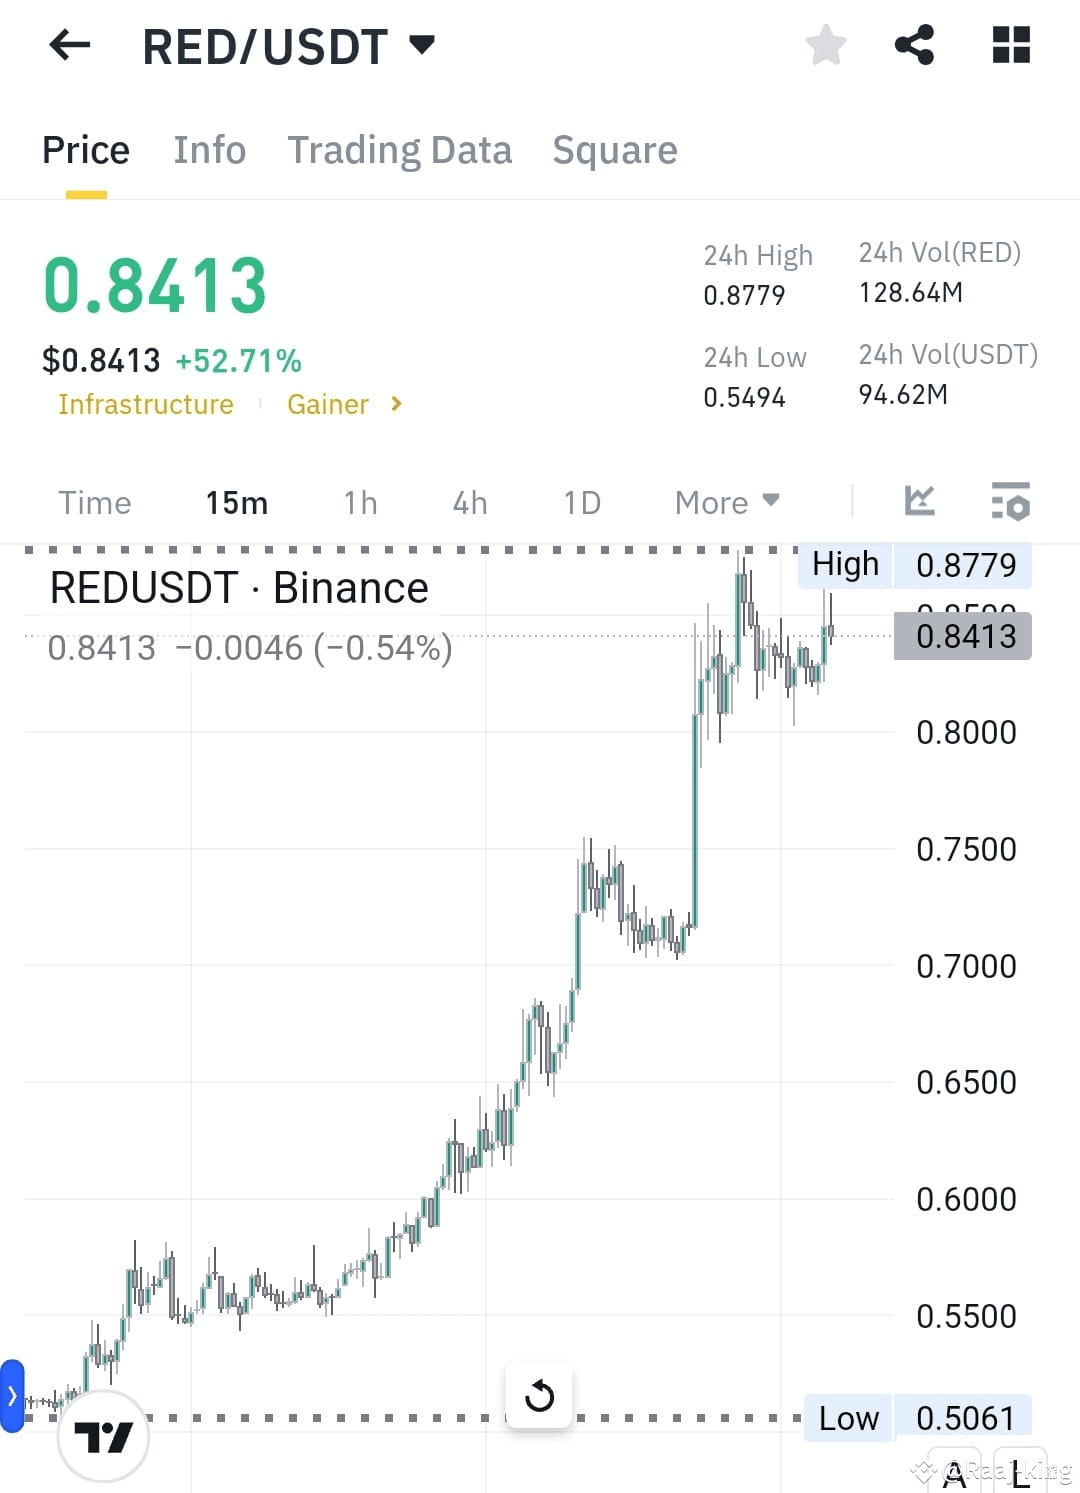
🚀 $RED /USDT – Market Overview & Trade Setup
🔍 Technical Indicators & Market Structure
1. Trend: RED is in a strong uptrend, gaining over 50% in the past 24 hours.
2. Moving Averages:
50 EMA (4H): $0.5500 (Acts as dynamic support)
3. RSI: Approaching overbought levels, potential for consolidation.
4. Volume: High buying pressure, but resistance near $0.8779 is crucial.
---
📌 Trade Setup for RED/USDT
✅ Bullish Scenario (Long Entry):
Entry: $0.8000 - $0.8200 (Buy near support)
Target 1: $0.8600
Target 2: $0.8779 - $0.9000
Stop Loss: $0.7800
Confirmation: If RED holds above $0.8200, it can push toward $0.8779 - $0.9000.
---
⚠️ Bearish Scenario (Short Entry):
Entry: $0.8600 - $0.8779 (Short near resistance)
Target 1: $0.8400
Target 2: $0.8200
Target 3: $0.8000
Stop Loss: $0.9000
Risk: If RED breaks and holds above $0.8779, short trades may be invalidated.
---
📊 Market Outlook & Summary
RED is exhibiting strong bullish momentum, but the $0.8779 resistance level is key. If rejected at $0.8779, expect a pullback to $0.8200 - $0.8000. A breakout above $0.8779 could push RED toward $0.9000+.
🔥 Stay alert & trade wisely! 🎯
#RED #reducecryptotax #BinanceAlphaAlert #Write2Earn #MarketPullback
🔍 Technical Indicators & Market Structure
1. Trend: RED is in a strong uptrend, gaining over 50% in the past 24 hours.
2. Moving Averages:
50 EMA (4H): $0.5500 (Acts as dynamic support)
3. RSI: Approaching overbought levels, potential for consolidation.
4. Volume: High buying pressure, but resistance near $0.8779 is crucial.
---
📌 Trade Setup for RED/USDT
✅ Bullish Scenario (Long Entry):
Entry: $0.8000 - $0.8200 (Buy near support)
Target 1: $0.8600
Target 2: $0.8779 - $0.9000
Stop Loss: $0.7800
Confirmation: If RED holds above $0.8200, it can push toward $0.8779 - $0.9000.
---
⚠️ Bearish Scenario (Short Entry):
Entry: $0.8600 - $0.8779 (Short near resistance)
Target 1: $0.8400
Target 2: $0.8200
Target 3: $0.8000
Stop Loss: $0.9000
Risk: If RED breaks and holds above $0.8779, short trades may be invalidated.
---
📊 Market Outlook & Summary
RED is exhibiting strong bullish momentum, but the $0.8779 resistance level is key. If rejected at $0.8779, expect a pullback to $0.8200 - $0.8000. A breakout above $0.8779 could push RED toward $0.9000+.
🔥 Stay alert & trade wisely! 🎯
#RED #reducecryptotax #BinanceAlphaAlert #Write2Earn #MarketPullback