---$SPX
🌟 SPX/USDT - Bullish Breakout in Play! 🌟
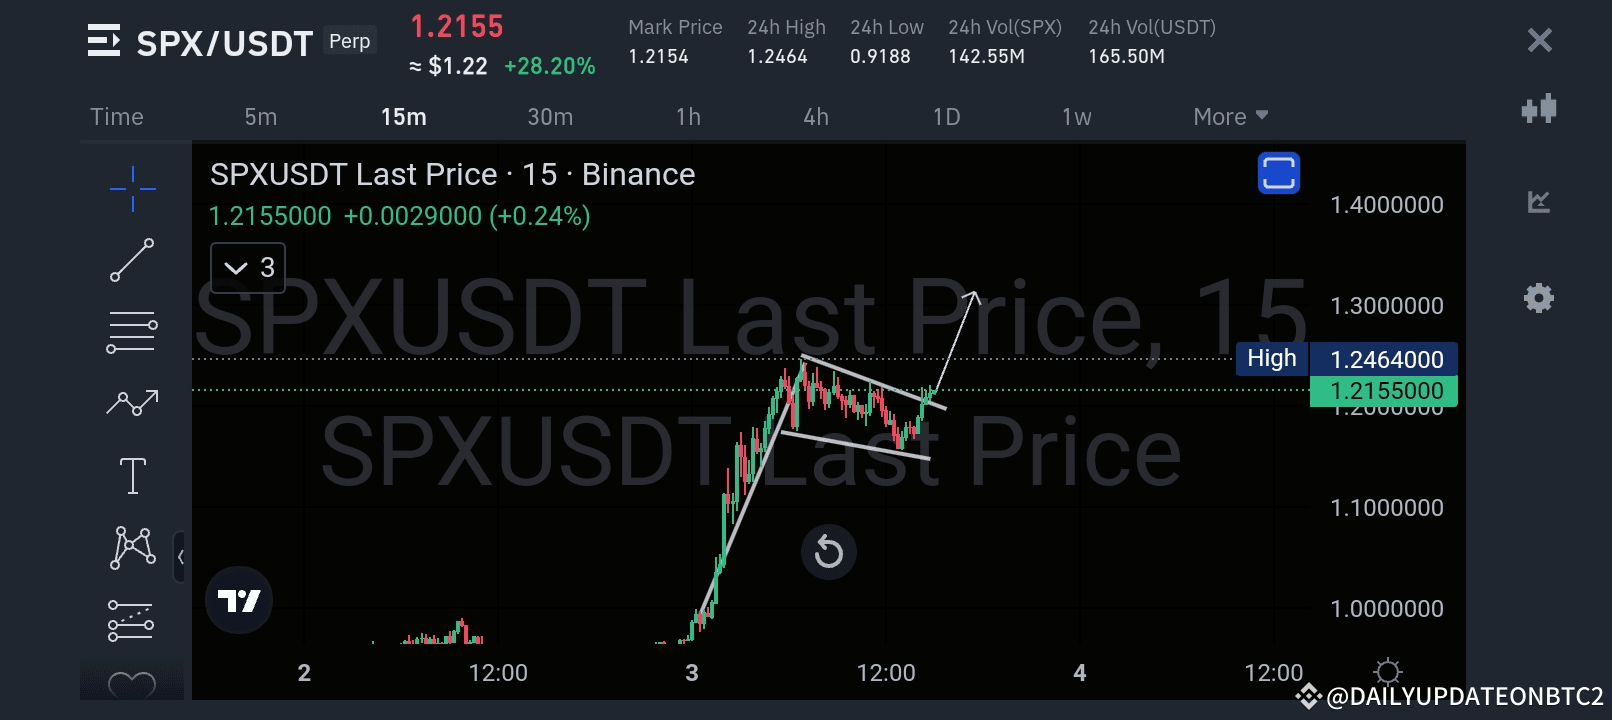
We’re witnessing an exciting development on the SPX/USDT chart. The 15-minute timeframe shows a textbook breakout from an ascending wedge pattern, suggesting that a bullish rally could be underway. Let’s dive into the details!
📊 Market Overview
Current Price: $1.2155
Resistance Level: $1.2464 (previous high)
24H High/Low: $1.2464 / $0.9188
Volume Surge: 165.50M USDT traded in the last 24 hours, signaling strong market interest.
---
🔍 Technical Analysis
1️⃣ The Pattern:
An ascending wedge was forming, and the price successfully broke above the upper trendline, confirming the bullish breakout.
This pattern often indicates strong upward momentum when confirmed with volume, which is clearly visible here.
2️⃣ Volume Confirmation:
The breakout is accompanied by a significant increase in volume, suggesting that buyers are dominating.
3️⃣ Potential Targets:
Target 1: $1.25 (short-term resistance)
Target 2: $1.30 (psychological level and extended resistance)
A sustained rally could push prices even higher, depending on market conditions.
4️⃣ Stop-Loss Recommendation:
Place your stop-loss at $1.20, just below the breakout zone, to minimize risk in case of a pullback.
---
🎯 Trading Strategy
📈 For Long Traders:
Entry around the current price of $1.2155 or on a pullback to $1.21.
Look for confirmation candles above $1.2464 to aim for higher targets.
📉 For Short Traders:
If the price fails to sustain above $1.2464, watch for rejection and trade cautiously.
💡 Pro Tip: Always manage your risk. Even the best setups can have reversals.
---
📌 Our Analysis
This breakout is significant as it aligns with strong technical indicators and market momentum. With a bullish structure in place and increasing volume, SPX/USDT is poised for a potential rally.
Let us know in the comments if you’re trading SPX/USDT and your thoughts on this breakout. 🚀
#BitcoinStart #SPXUSDT #CryptoBreakout #BinanceTrading
---