Market Analysis: Virtual/USDT on the 4H Chart
---$VIRTUAL
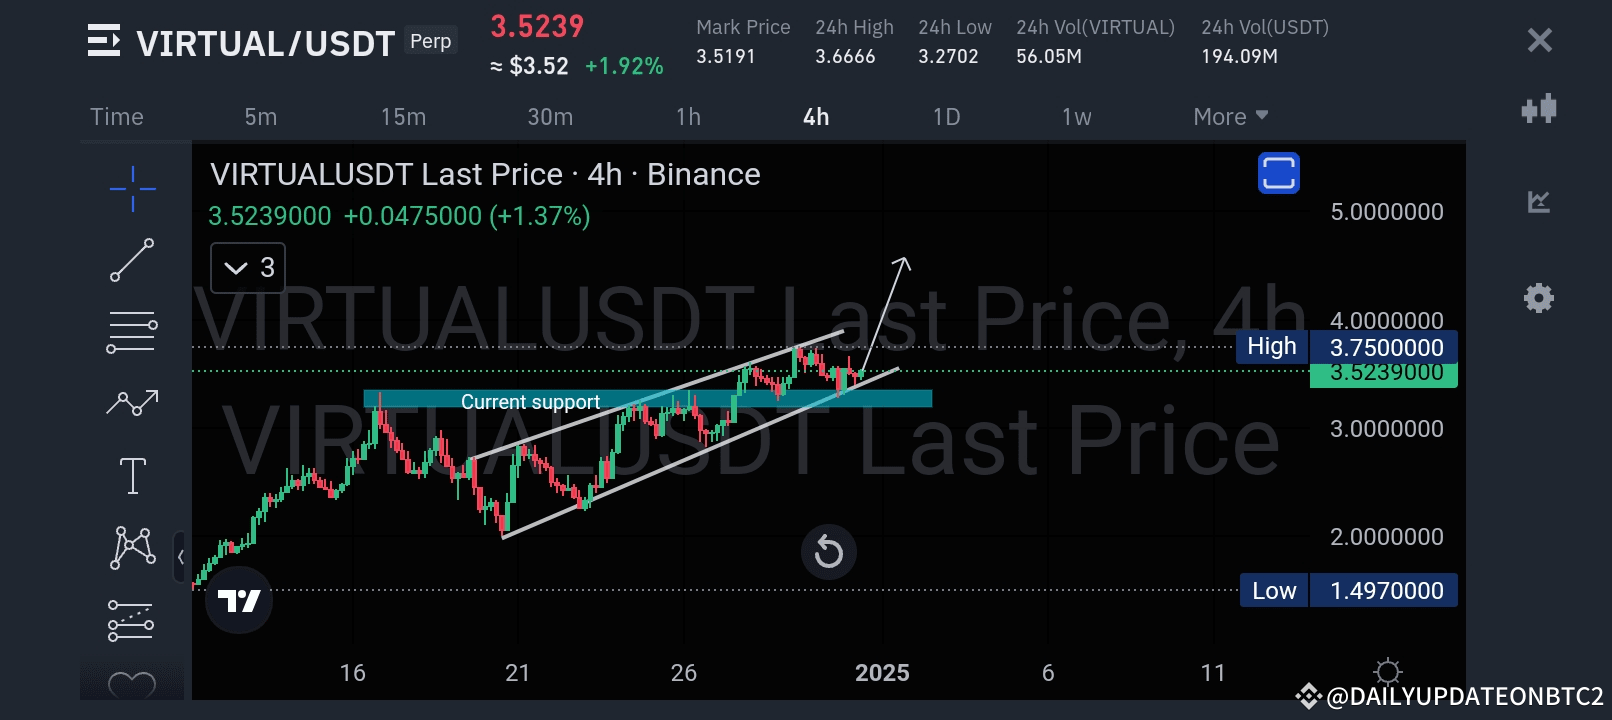
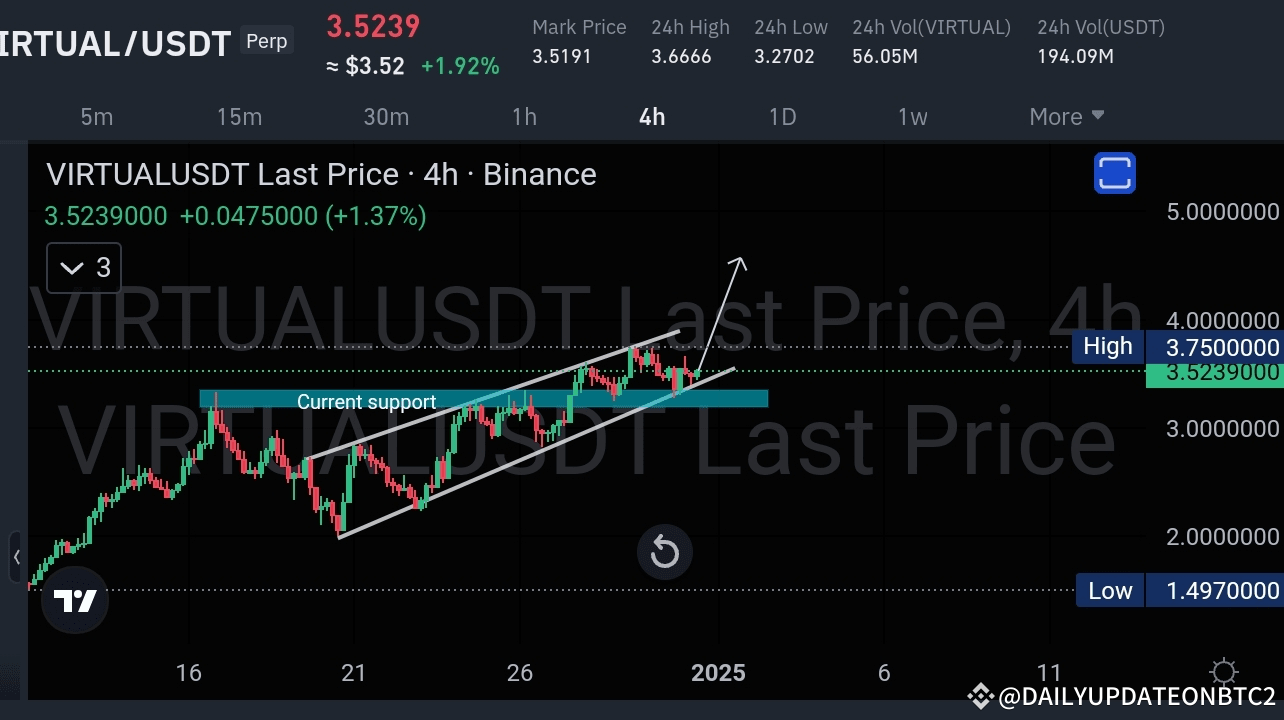
The chart shows VIRTUAL/USDT trading within a rising channel on the 4-hour timeframe, maintaining its bullish structure. Let's break it down:
Key Observations
1. Current Price: $3.52, reflecting a +1.92% gain over the last 24 hours.
2. Channel Formation:
The pair is trading in an upward-sloping channel, with clear higher highs and higher lows.
The current support lies near the $3.50-$3.52 region, as shown in the chart.
3. Highs and Lows:
24H High: $3.75
24H Low: $3.27
This demonstrates a strong intraday price movement within the channel boundaries.
Potential Scenarios
1. Bullish Continuation:
If the price maintains support near $3.50 and breaks above $3.75, it could push towards higher targets within the channel, possibly aiming for the psychological $4.00 level.
2. Bearish Rejection:
A breakdown below the current support could see the price testing the lower boundary of the channel, near $3.30-$3.25.
Trading Strategy
For Long Positions:
Enter near the lower boundary of the channel ($3.50), with a target of $3.75 or higher. Keep a stop-loss below $3.45 to manage risk.
For Short Positions:
Consider shorting if the price fails to sustain above $3.75 and starts showing bearish momentum, with a target near $3.30.
Final Thoughts
The price action suggests a bullish bias, as the pair remains in an ascending structure. However, traders should monitor volume and any breakout/rejection closely.
Stay tuned for updates as VIRTUAL/USDT progresses through this channel. Manage risk, and happy trading!
Disclaimer: This is not financial advice. Conduct your own analysis before making any trading decisions.
---