
Overview:
DEXE is looking bearish on the 4-hour chart, as technical indicators point to weak buying power and increasing selling pressure.
Key technical indicators:
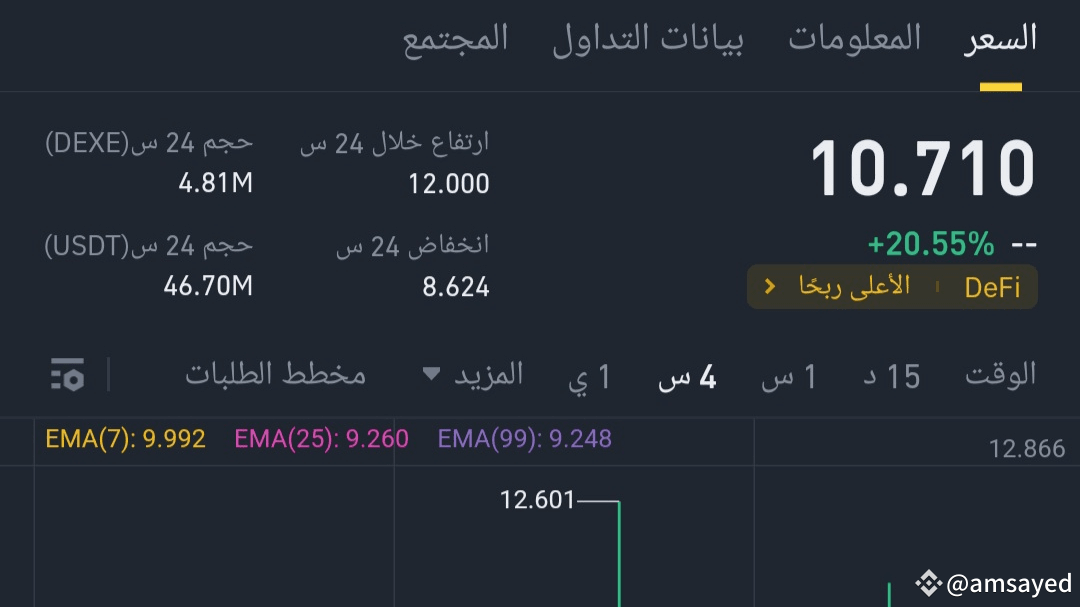
* Moving Averages: The short, medium and long moving averages indicate a downtrend, as currency prices lie below all averages.
* MACD Indicator: The MACD indicator shows the sema line below the signal line, indicating negative momentum and increasing selling pressure.
* RSI: The Relative Strength Index (RSI) is fluctuating around the 50 level, indicating that there is no clear buying or selling power at the moment.
* Trading volume: Trading volume is relatively low, which may indicate a lack of interest in the currency by traders.
Support and resistance areas:
* Support: The level around 8.988 can be considered as strong support, as the currency has previously seen a bounce from this level.
* Resistance: The level around 10.614 represents strong resistance, as the currency failed to break through it several times.
Recommendations:
* In the short term: Due to the current selling pressure, the price of the currency may continue to decline towards the next support level.
* Trading: Extreme caution is advised when trading this currency at the present time, as market conditions are unstable.
* Investment: It may be best to wait until there are clearer signs of an improving trend before considering investing in this currency.
note:
This analysis is based on data available as of today, and market conditions may change rapidly. Therefore, it is always advisable to conduct a comprehensive fundamental technical analysis before making any investment decisions.
alert:
Trading in cryptocurrencies is risky, and you may lose part or all of your investment.
For a more accurate analysis, it is preferable to look at:
* News: Any news or events that may affect the currency price.
* Chart analysis: studying different price patterns that may indicate future direction.
* Expert Opinion: View the opinions of experts and analysts in the cryptocurrency market.


