4 hours). Here's a quick analysis with a look ahead:
Technical analysis:
1. General trend:
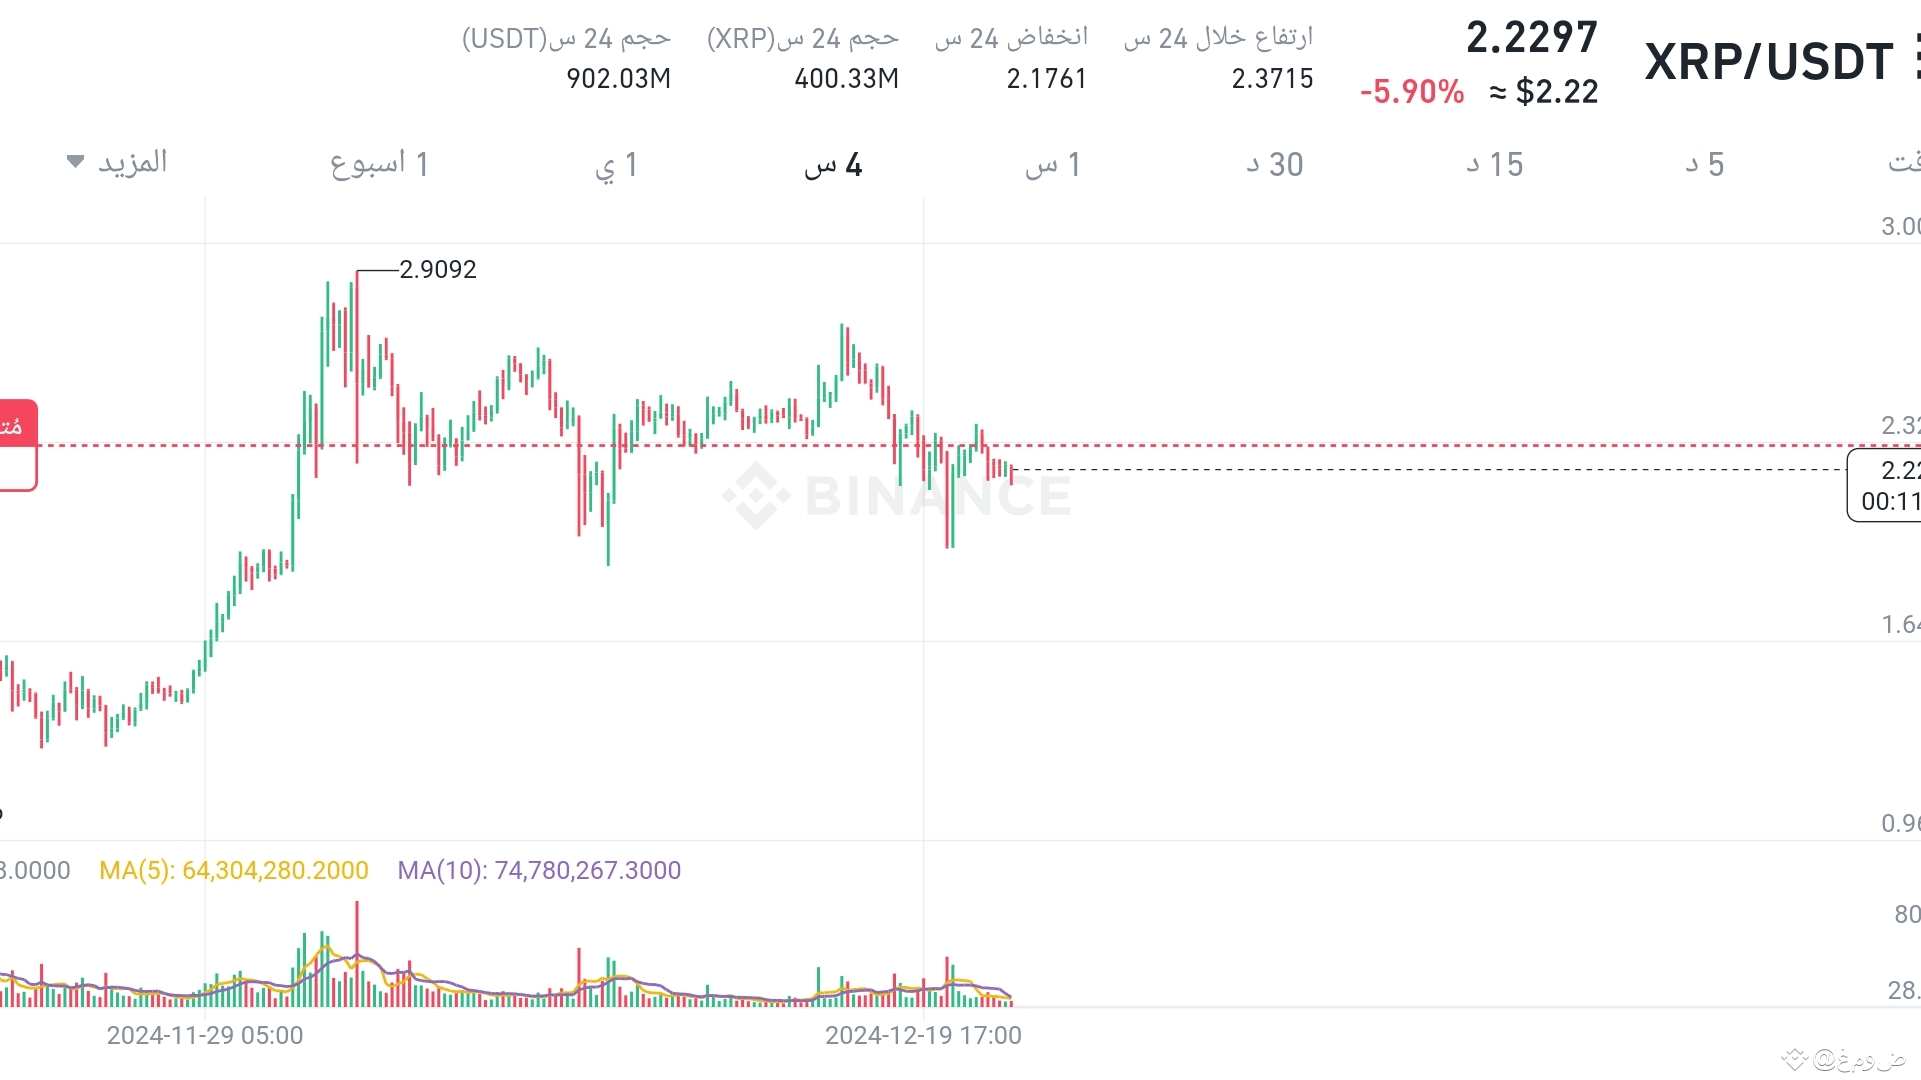
The price has declined from the recent high at 2.9092 to a current level near 2.2297.
This indicates a short-term downtrend with a correction from the highs.
2. Average selling price (2.3116):
The current price is below the average selling price, which means the market is at a loss for investors who sold at this average.
3. Support and resistance levels:
Current support: at 2.1761 (lowest level in the last 24 hours).
Current resistance: at 2.3222 (close to the average selling price).
4. Trading volumes:
The trading volumes in the recent period show a relative decrease compared to the peak of the rise. This may indicate a decline in the bearish momentum, but with caution.
5. Auxiliary indicators:
MACD and EMA: If you want a more accurate analysis using these indicators, you can watch the intersection of the MACD lines and the moving averages (EMA) for reversal signals.
Future outlook:
Positive scenario:
If the price can break the resistance level at 2.3222, we may see an attempt to test higher levels (such as 2.3715 or even a return towards 2.9092).
This should be accompanied by a clear increase in trading volumes to boost momentum.
Negative scenario:
If the price fails to hold above the support level of 2.1761, it may continue to decline towards lower levels such as 1.90 or even 1.64.
Following the trading volumes and a break below the crucial support levels will confirm the downtrend.
Recommendations:
For speculators: Watch key support and resistance points carefully, and use stop loss to reduce risk.
For investors: If you intend to buy, wait for a clear confirmation of a trend reversal or price consolidation above the 2.3222 level.
؟