Among the many technical analysis tools, the symmetrical triangle pattern stands out as one of the most accurate and effective patterns 🚀, especially when used correctly in determining market trends and making investment decisions 💡. For me, this analysis has always proven to be 100% successful, which makes it an essential part of my trading strategy 🎯.
What is a symmetrical triangle pattern?
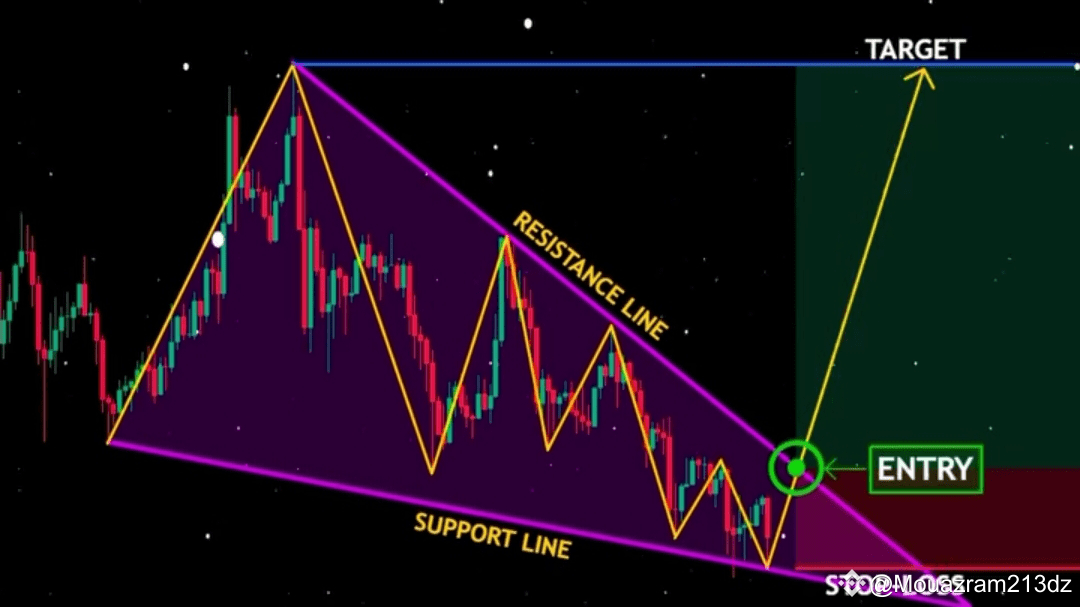
A symmetrical triangle is a pattern that appears when price action is confined between a descending resistance line and an ascending support line 📊. This pattern represents a period of relative balance between supply and demand forces ⚖️, and is usually followed by a major breakout in one of the two directions (up or down) 🚦.

Why do I believe in his success?
1. Balance between supply and demand:
The symmetrical triangle reflects a struggle between buyers and sellers 🤝. Eventually, one of them wins out, leading to a clear breakout, making it easier to determine the next trend 🚀.
2. Ease of identifying entry and exit points:
Entry point: Occurs when the price breaks the resistance or support line 🟢.
Stop Loss: It is placed below/above the support or resistance line to ensure risk reduction 🚫.
Profit Target: It is calculated based on the distance between the highest and lowest point within the triangle 🎯.
3. Repeated success across different time frames:
Whether you are a day trader or a long-term investor ⏳, the symmetrical triangle appears in all markets (stocks 📈, forex 💱, cryptocurrencies 💻), and works surprisingly efficiently ✅.
Personal experience
Over the years of using this analysis, I have noticed that its success depends not only on the pattern itself, but also on:
Discipline in applying its rules 💪.
Manage risk by setting a clear stop loss 🛡️.
Be patient until the breakout becomes clear ⏳.
Common shortcomings and how to overcome them
Pattern Misidentification: Sometimes traders make mistakes in drawing support and resistance lines ✏️. The solution is to constantly practice and analyze past patterns 🔍.
False breakout: It may happen that the price breaks and then returns back within the pattern ⚠️. The solution is to wait for confirmation of the breakout via candles or other indicators ✅.
Lack of a risk management plan: Even with perfect analysis, a clear stop loss strategy must be in place 🚨.
Conclusion
The symmetrical triangle pattern is a powerful tool that guarantees success when used systematically and thoughtfully 🧠. For me, this pattern always proves to be 100% correct because it combines simplicity and efficiency 🔥. However, discipline and careful analysis remain crucial to achieving the desired results 🏆.