---$HBAR

HBAR/USDT Analysis – Breakout in Play! 🚀
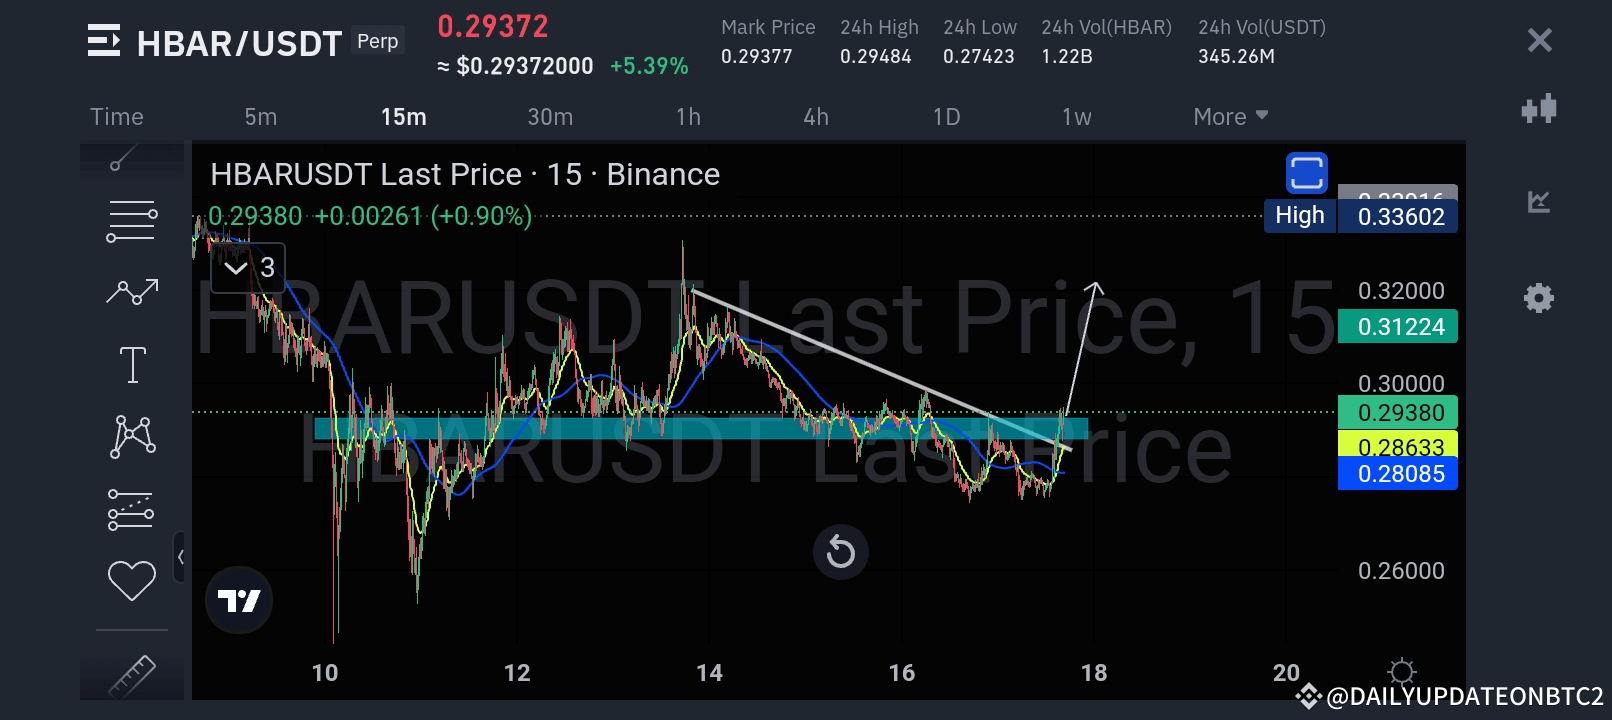
The market is heating up, and HBAR/USDT is showing promising signs of bullish momentum. A strong breakout above the descending trendline suggests that buyers are stepping in and preparing for a potential move higher.
🔍 Chart Insights
After multiple attempts, HBAR has successfully broken the trendline resistance.
It is now trading at 0.2938, which is a critical level near previous support zones.
The breakout has pushed the price into the blue resistance zone, indicating a shift in momentum.
📊 Key Price Levels
Support Levels (where buyers might step in again):
🔵 0.2863
🔵 0.2808
Target Levels (next resistance areas to watch):
🟢 0.3122 – First target, where some resistance may appear.
🟢 0.3200 – Next psychological and technical resistance level.
📈 What to Expect
If the breakout holds and HBAR stays above the blue zone, the price could quickly rally toward the first target at 0.3122. Breaking above this level with volume would confirm the bullish momentum and open the door for the next target at 0.3200.
However, if HBAR faces rejection and drops below 0.2863, it could retest support around 0.2808. This is an important zone to monitor closely.
---
⚠️ Trading Strategy & Reminder
Long positions look favorable as long as the breakout holds above the blue zone.
Keep an eye on volume and price action near the resistance levels for confirmation.
Always use proper stop-losses to protect your trades and avoid unnecessary risk.
---
Conclusion: HBAR/USDT is showing great potential for a strong upside move. The breakout is a bullish signal, and the targets at 0.3122 and 0.3200 remain the next milestones. Trade wisely, stay disciplined, and manage your risk effectively.
What’s your take on this breakout? Are you long on HBAR? Let me know in the comments! 🚀
---