Graphic Analysis
1. Target and Prices
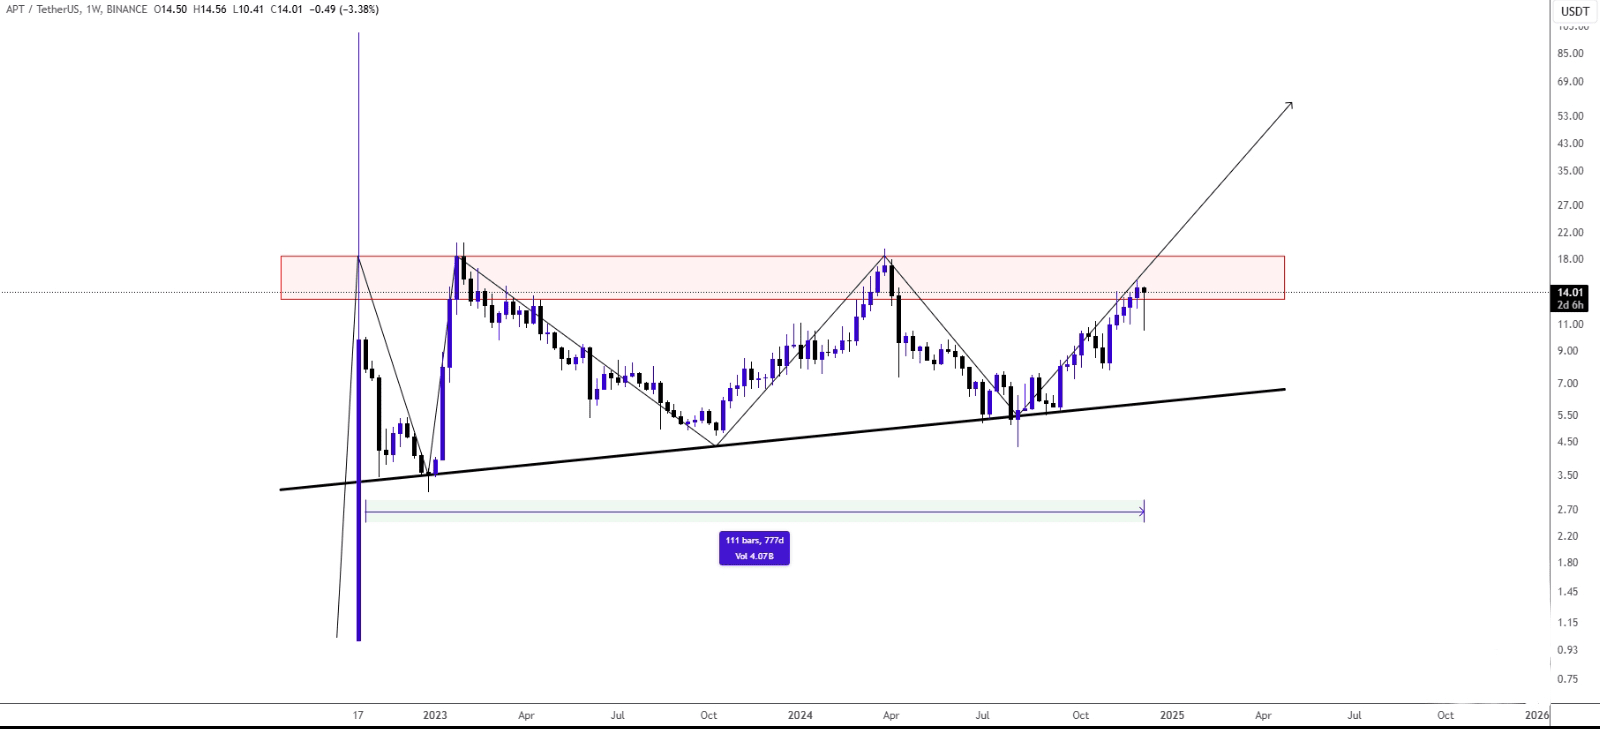
• Main target: Current price action in the 14 USD area shows potential for an upward breakout. If the resistance area (17-18 USD) is broken strongly, the price has the potential to move towards the 22-25 USD range and then to the 30-35 USD levels.
• Lower target: If the breakout fails, a pullback to support levels can be expected.
2. Support and Resistance Levels
• Supports:
• Initial support: 12-12.50 USD
• Second support: 9 USD
• Third support: 7 USD (Near the main trend line)
• Resistors:
• First resistance: 17-18 USD
• Second resistance: 22 USD
• Third resistance: 35 USD
3. Indicators
• Volume: Increases are observed at breakout zones. This is an important confirmation of a strong upward movement.
• Trend Indicators: Moving averages, especially long-term MAs (e.g. 50 and 200-day), confirm that the price is trending upwards.
• RSI: Not yet nearing the overbought zone but showing upward momentum. This could signal a potential continuation.
4. Formations and Formation Reversals
• A distinct double bottom or ascending triangle formation is noticeable on the chart. The upper band of the ascending triangle is in the 17-18 USD region.
• If the double bottom formation is completed, the target can be expected to be 25 USD.
5. Trend Direction
• Trend: Upward (especially on the weekly chart). The rising trend line is maintained. This provides a positive outlook in the medium and long term.
Strategy
1. Purchase Strategy:
• 17-18 USD breakout: If the price rises above this area, buying can be done.
• Buying opportunities can be evaluated by looking for a reaction at previous support levels (12-12.50 USD).
2. Profit Taking Strategy:
• First profit taking level: 22 USD
• Second profit taking level: 30 USD and above
3. Stop Loss:
• In case of falling below 9 USD, positions should be reviewed.
4. Points to Consider:
• No transactions should be made without volume and breakout confirmation.
• Attention should be paid to the overbought region in oscillators such as RSI.
General Comment
The APTUSDT chart has a strong uptrend potential. Breakout zones should be watched carefully. Especially movements above 17-18 USD can carry the price to higher targets. However, a fall below the main trend line will weaken bullish expectations. Therefore, attention should be paid to risk management.