Analysis and Comment:
Chart Review:
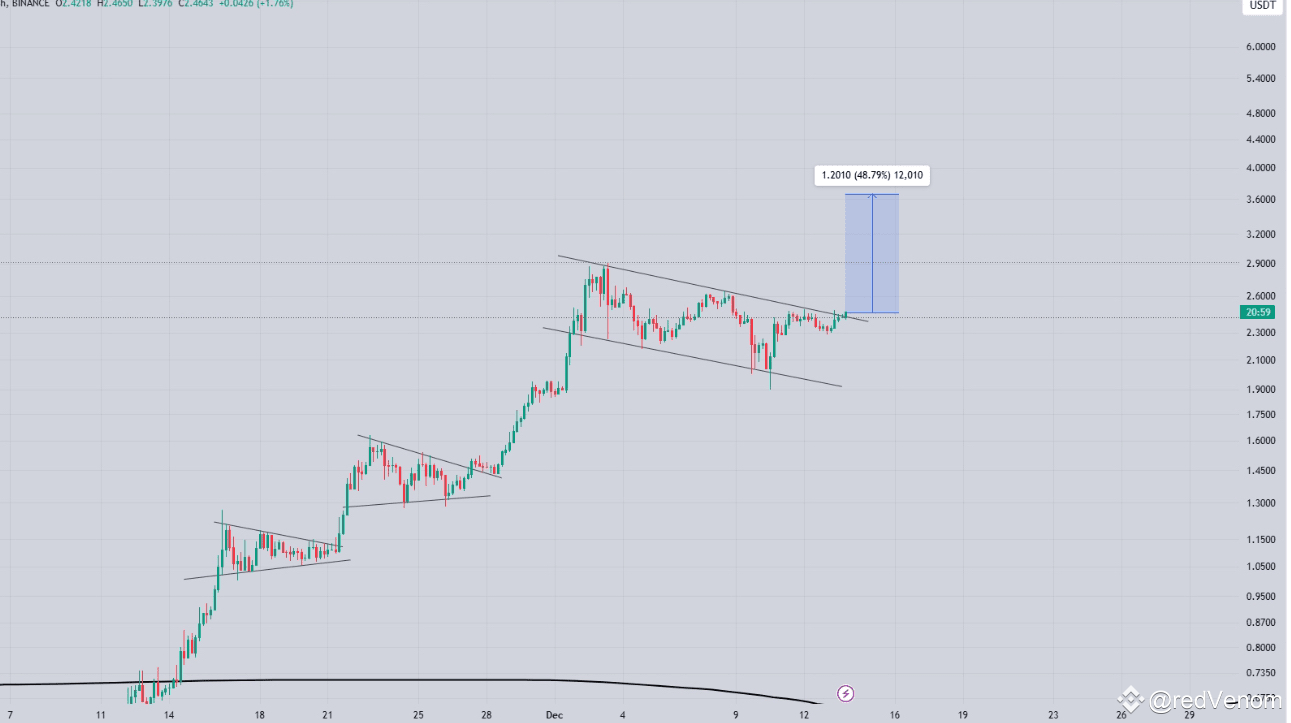
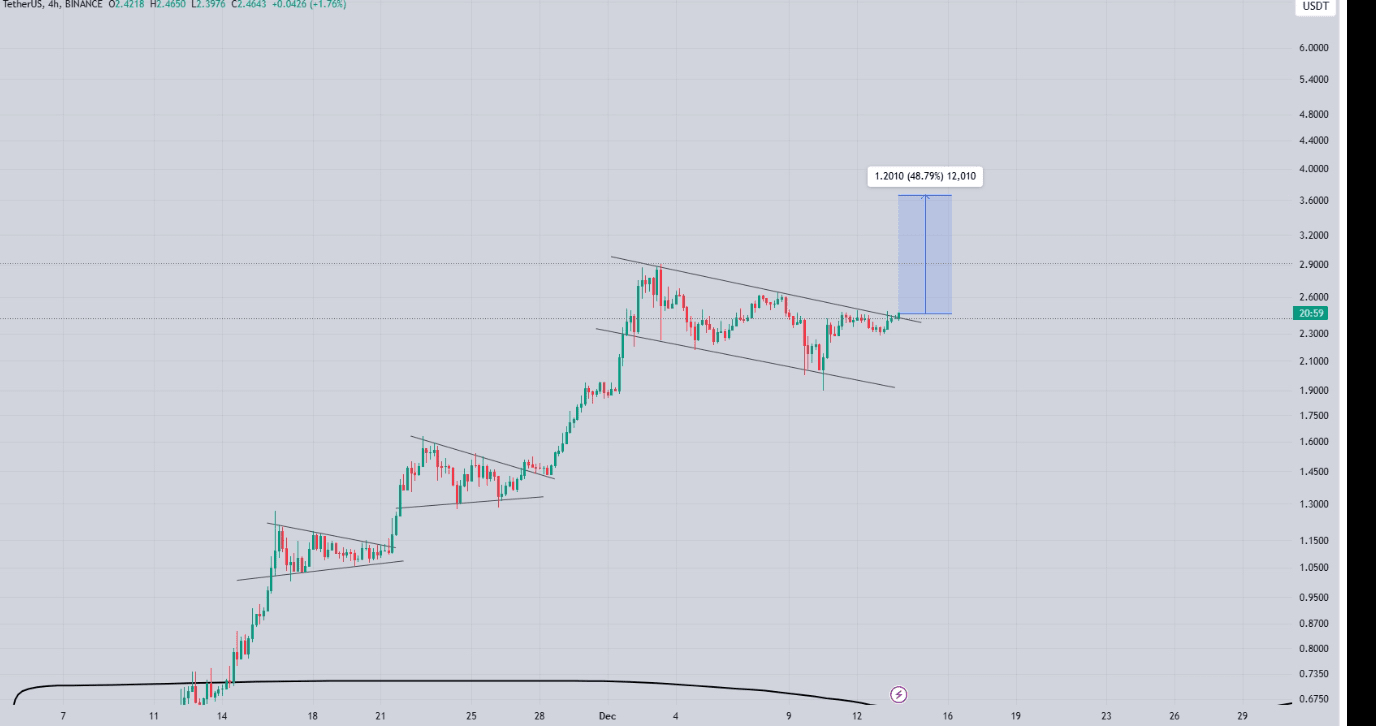
The chart clearly shows an upward trend. After each upward wave, the price consolidates with a narrowing formation (falling wedge) and breaks upward again after this consolidation.
Target and Prices:
• Target: The potential target area indicated on the chart is around 3.60. This level represents a gain of approximately 48% based on the current price.
• After the breakout, the price seems likely to reach this target, but attention should be paid to possible selling pressures from intermediate resistance levels.
Support and Resistance Levels:
• Supports:
• 2.30: Last breakout level.
• 2.00: A strong support area, if the price breaks this level, the trend may be broken.
• Resistors:
• 2.90-3.00: Psychological and intermediate resistance.
• 3.60: Target zone and strong resistance level.
Indicators:
• Bollinger Bands: May indicate that the horizontal movement is narrowing and a possible breakout.
• RSI: Caution should be exercised as it approaches the overbought territory, but momentum is positive.
• MACD: Upward signals are strong. Momentum may continue.
Formations and Turns:
• The chart shows that falling wedge formations are broken upwards after each consolidation. This indicates a bull market.
• The expected price target for the next upward movement after the breakout could be 3.60.
Trend Direction:
• The general trend is upward and the bull market is dominant. Previous breakouts support that the trend is strong.
Strategy and Recommendations:
1. Entry Strategy:
• When confirmation of the breakout above 2.50 is received, a buying opportunity can be evaluated.
• For short-term traders, the target may be between 2.90-3.00.
2. Stop Loss:
• If there is a daily close below 2.30, positions should be reviewed.
3. Profit Taking:
• First target levels are 2.90-3.00.
• Second target level is 3.60.
4. Risk Management:
• Position size should be monitored to avoid sudden fluctuations by controlling the transaction volume.
• Caution should be exercised when RSI and other momentum indicators reach the overbought region.
Conclusion:
The price trend and formations indicate that the upward movement will continue. As long as it remains above 2.30, the bull scenario is valid. However, market risks and global factors should be taken into consideration when making investment decisions.