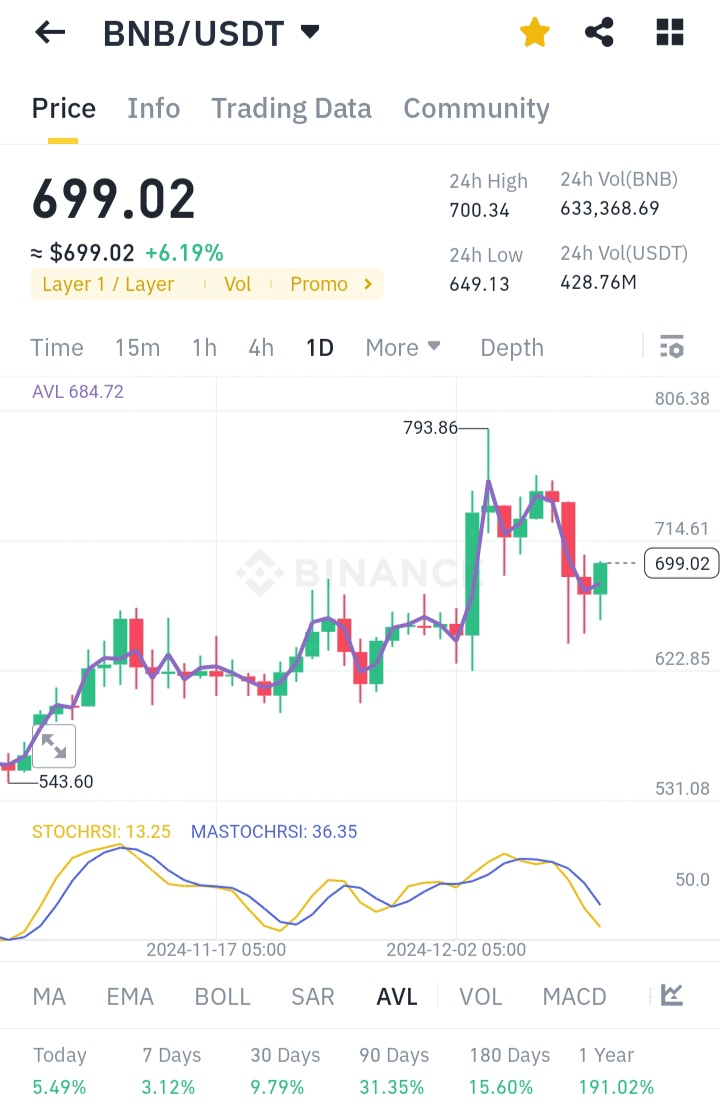
Technical Analysis for Binance Coin $BNB
Binance Coin $BNB has demonstrated mixed but promising technical indicators in December 2024, reflecting its position as a top cryptocurrency. Here's an overview based on current market trends and technical insights:
Price Action and Market Trends
Current Price and Support Levels: BNB is trading around $589–$600, supported by strong buying interest near $589.8, suggesting stability at this level. However, short-term bearish pressures may emerge due to profit-taking by sellers.
Resistance Levels: The next key resistance lies at approximately $639, with bullish sentiment potentially pushing the price higher as market conditions improve.
Volatility: Indicators such as open interest in derivatives have increased by 0.4% to $528 million, hinting at rising trader confidence and potential price swings.
Key Technical Indicators
Relative Strength Index (RSI): The RSI for BNB is currently at 57, indicating moderate bullish momentum with room for further gains before reaching overbought levels.
Moving Average Convergence Divergence (MACD): The MACD line is signaling a potential bullish crossover. This indicator points to continued upward momentum if sustained.
Volume and Liquidity: While daily trading volume remains robust at $1.68 billion, liquidations of long positions indicate caution among leveraged trader.
Price Prediction
Short-Term Outlook: Analysts expect BNB to maintain its bullish trajectory, with potential to test $639–$650 by the end of December 2024.
Long-Term Potential: BNB is projected to grow substantially in the coming years, crossing $800 in early 2025 and potentially exceeding $2,000 by 2027 as adoption and demand increase.
Conclusion
BNB's strong fundamentals, combined with bullish technical indicators, make it a coin to watch. Traders should monitor key levels around $589 (support) and $639 (resistance) while factoring in broader market conditions. Caution is advised due to potential short-term volatility, but the long-term outlook remains highly positive.