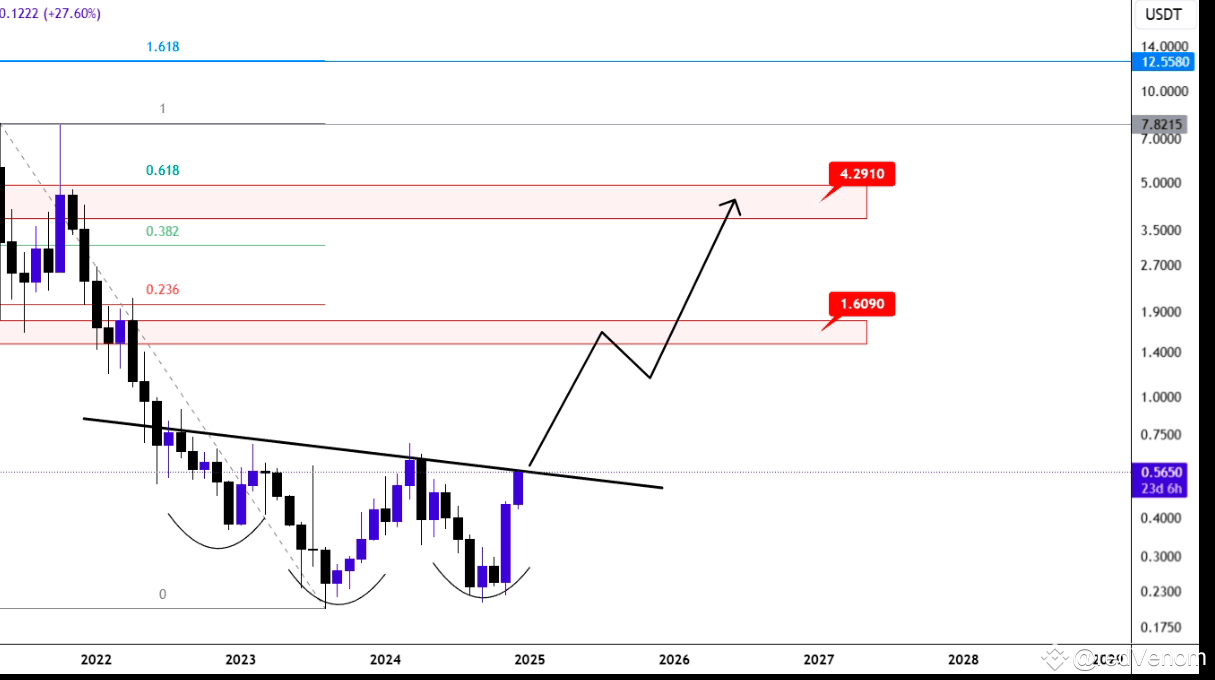
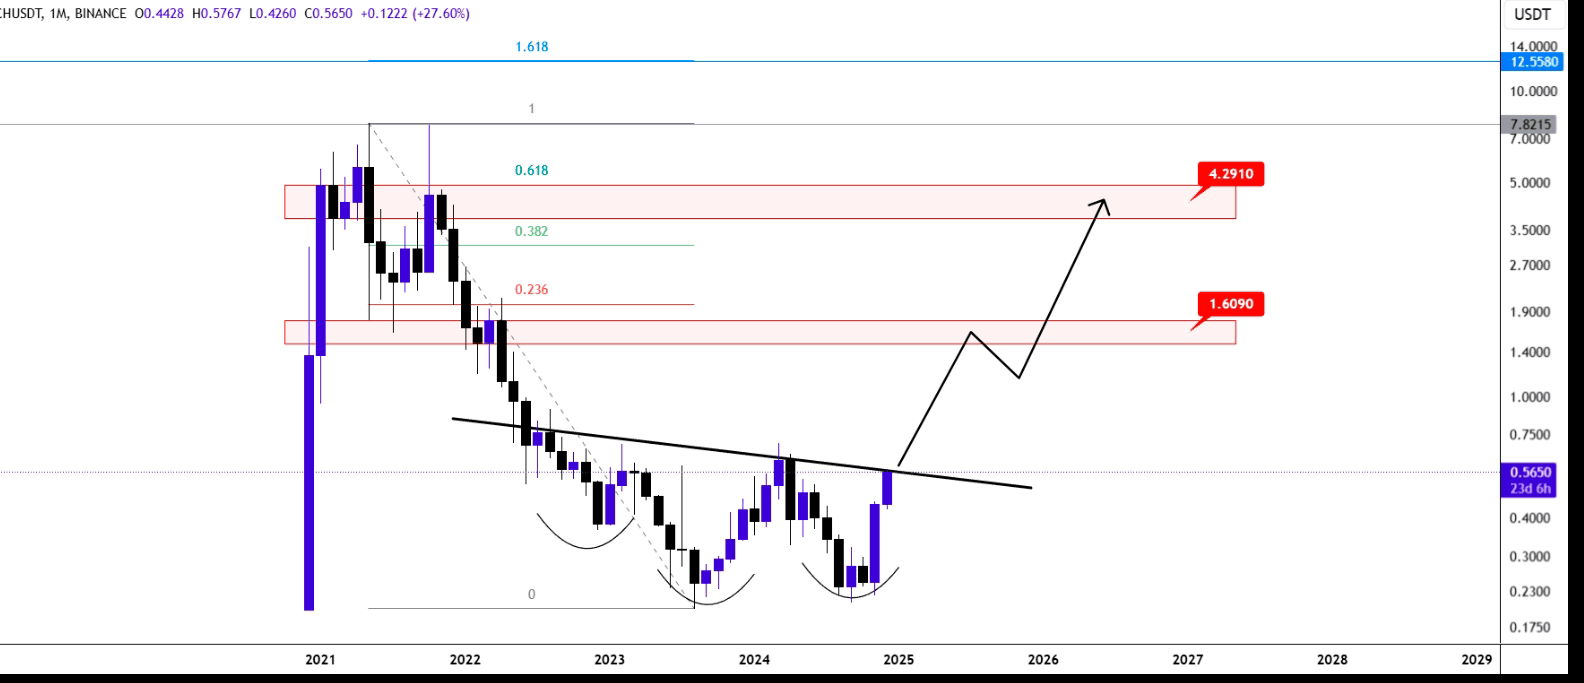
1. Target and Prices
The levels 1.6090 and 4.2910 appear to be targets on the chart. These levels are marked in accordance with Fibonacci retracement points. The main resistance level is 4.2910, reaching this level indicates a possible price increase in the long term.
2. Support and Resistance Levels
• Support Levels:
• The 0.40 level stands out as a strong support. The recovery movement from here may support the upward momentum.
• Resistance Levels:
• It seems that the first resistance level will be tested at 1.6090.
• The higher target level was determined as 4.2910.
3. Indicators
Since no indicator is given in the chart, in line with the general market analysis:
• RSI: It may be approaching the overbought area. It is important to check this.
• Volume: Increasing volume as price rises may indicate that the uptrend is a healthy one.
4. Formations and Formation Reversals
The chart shows an inverse head-and-shoulders (H-S) pattern. This pattern usually signals trend reversals and signals that an uptrend may begin for this chart.
5. Trend Direction
• An upward trend is predicted in the long term.
• The broken trend line seems to confirm the upward movement.
6. Strategic
• Short-Term Strategy: It may be logical to take a position up to 1.6090. However, it is important to minimize the risk by placing the stop-loss level below the 0.40 support.
• Long Term Strategy: A long term hold strategy can be implemented by targeting the 4.2910 level. However, it is necessary to constantly monitor market dynamics during this process.
Clear and Detailed Comment
This chart shows that it has entered an uptrend and is moving towards certain targets. The 1.6090 level is a reasonable first target. Then, the 4.2910 level is one of the reachable targets. However, when reaching these levels, you need to consider macro factors such as market sentiment, movements of major assets such as Bitcoin, and global economic conditions. It is important to determine stop-loss and take-profit points in your strategy.