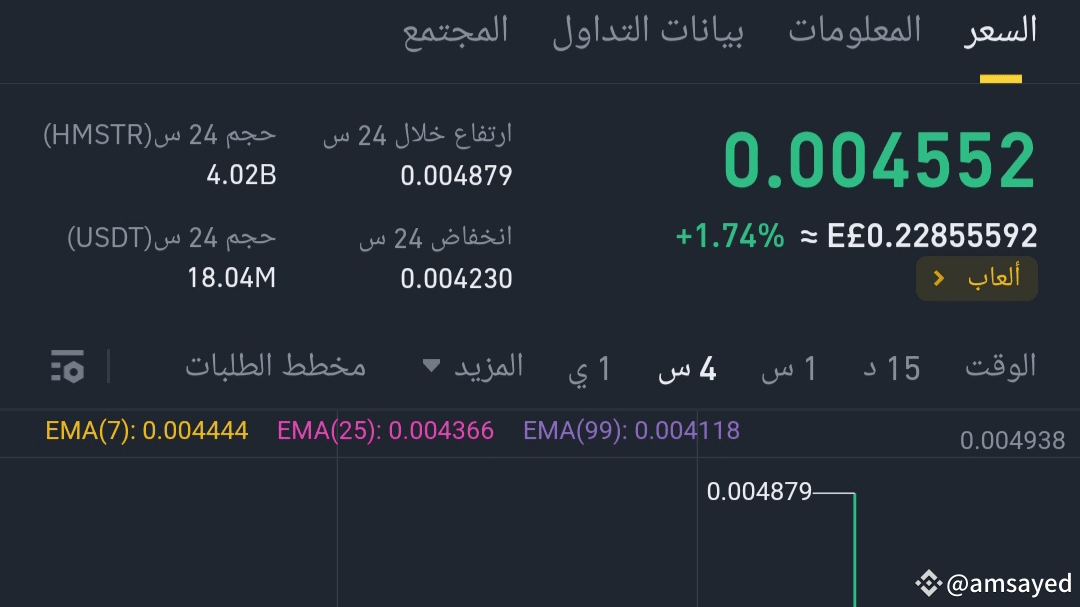

1. Current price:
The current price is 0.004552, up +1.74% in 24 hours.
2. Candlestick analysis:
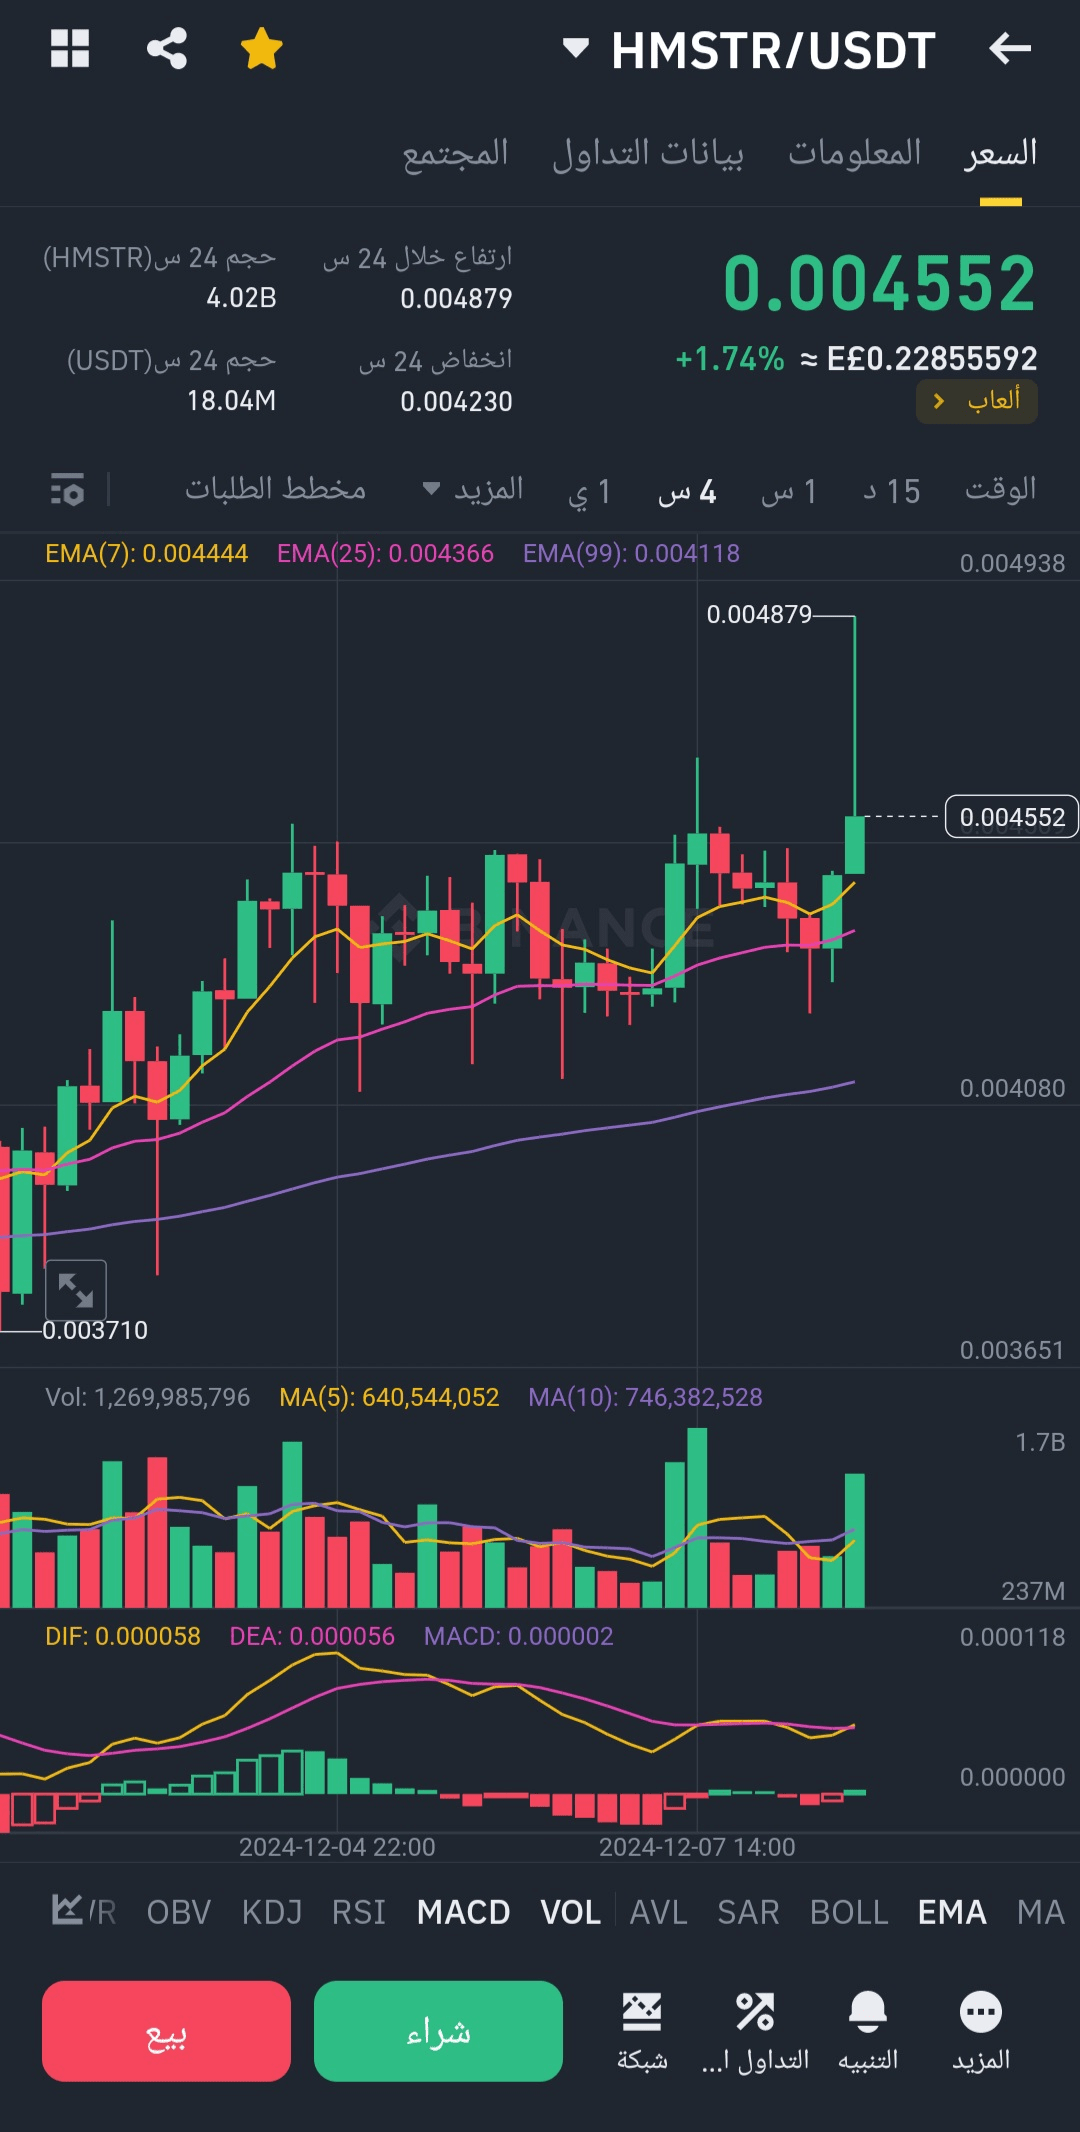
The last candle shows a strong uptrend, closing at the top of the price, indicating strong buying pressure and the possibility of a continued uptrend.
3. Moving Averages (EMA):
EMA(7) at 0.004444, EMA(25) at 0.004366, EMA(99) at 0.004118.
The current price is above all moving averages, indicating a strong uptrend.
4. MACD Indicator:
MACD line shows the beginning of a bullish crossover (DIF is above DEA), which reinforces the buy signal.
5. Trading volume:
The trading volume is high, confirming the strength of the upward movement. Increasing volume with bullish candles is a positive signal.
6. Support and resistance levels:
Current resistance is at the previous high of 0.004879.
Nearby support is at the EMA(25) around 0.004366.

Expectations:
If the price continues to hold above the moving averages and with strong trading volume, the price may target the next resistance levels.
In case of a bounce, the price could head towards support levels at 0.004366 or EMA(99) at 0.004118.
