

JOIN MY LIVE FOR PREMIUM SIGNALS
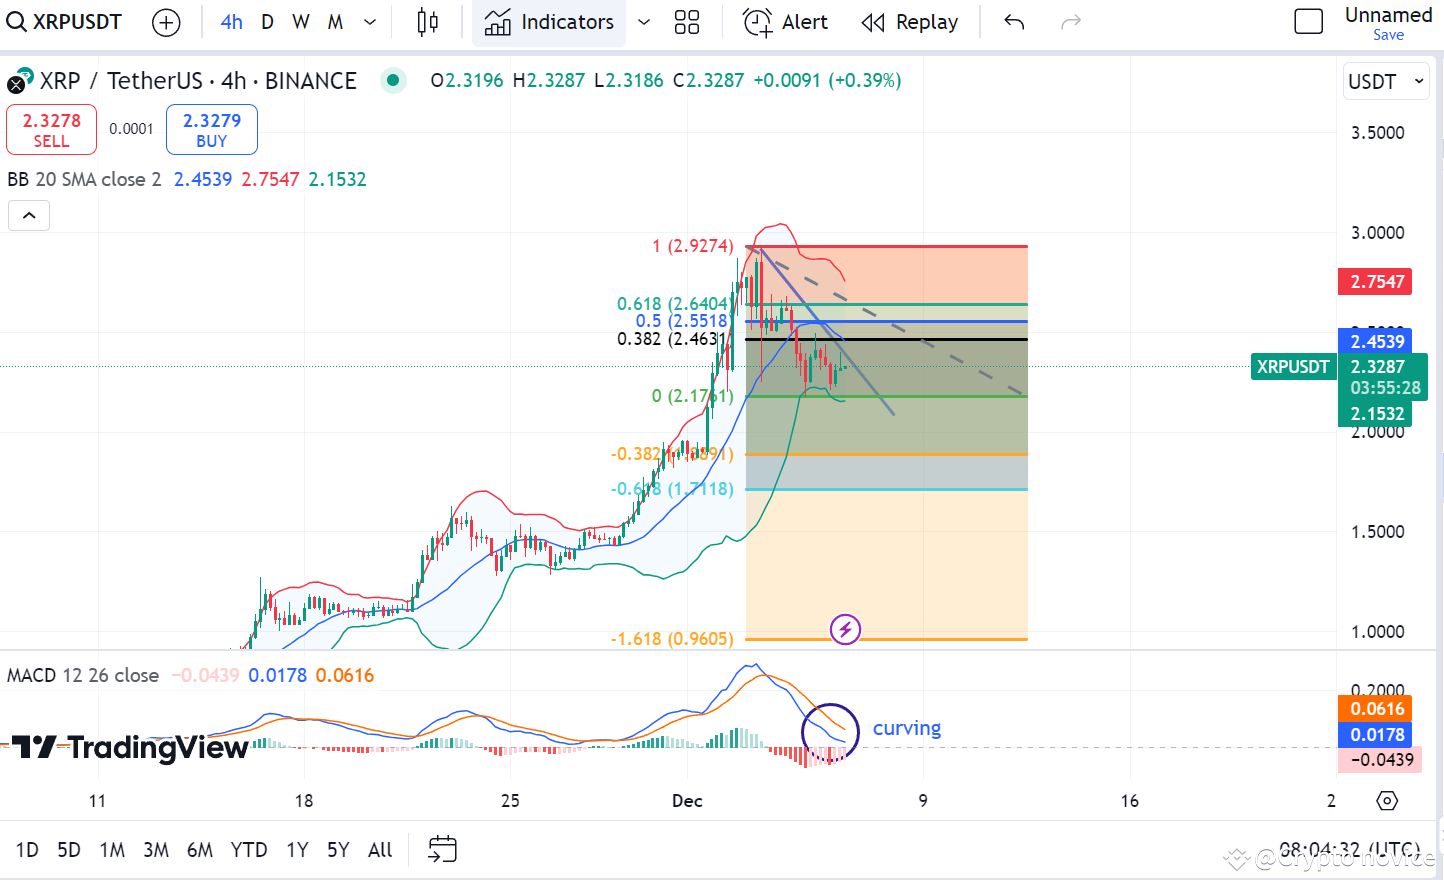
Coin name- #XRPUSDT🚨
Signal type- Short
Here we can see in my added picture that XRP is bearish. Fibbo is showing that it touching the level 0.382 to go down. Bollinger bands is also indicating bearish .It's upper line starting to curve down. MACD is also showing that the two line going downward.
On XRP pair ETH, we can see that XRP is performing bad. Bollinger bands ribbons have curved down, indicating bearish. MACD is also showing over crossed to down with good volume as shown in the picture.
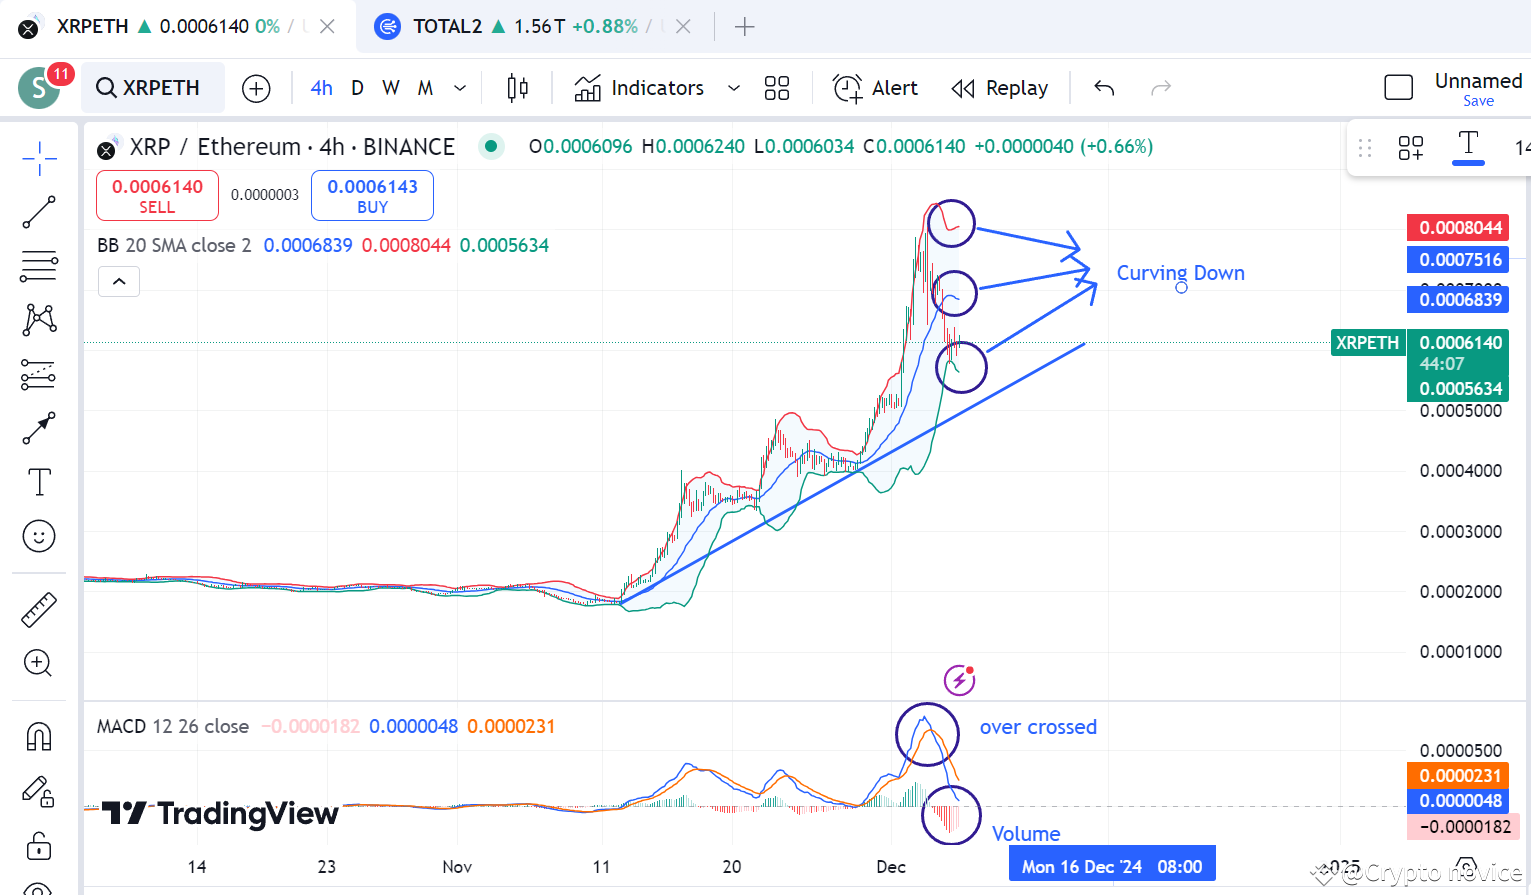
xrp pari eth
Here we can see a symetric triangle chart pattern is being created. As we all know that BTC has reached at price 100k. Because it broke out its resistance level. I can predict that Bitcoin will pump up to at least 140k. MACD indicators is also indicating Bitcoin bullish, because both the lines have crossed each other showing the market will now pump.
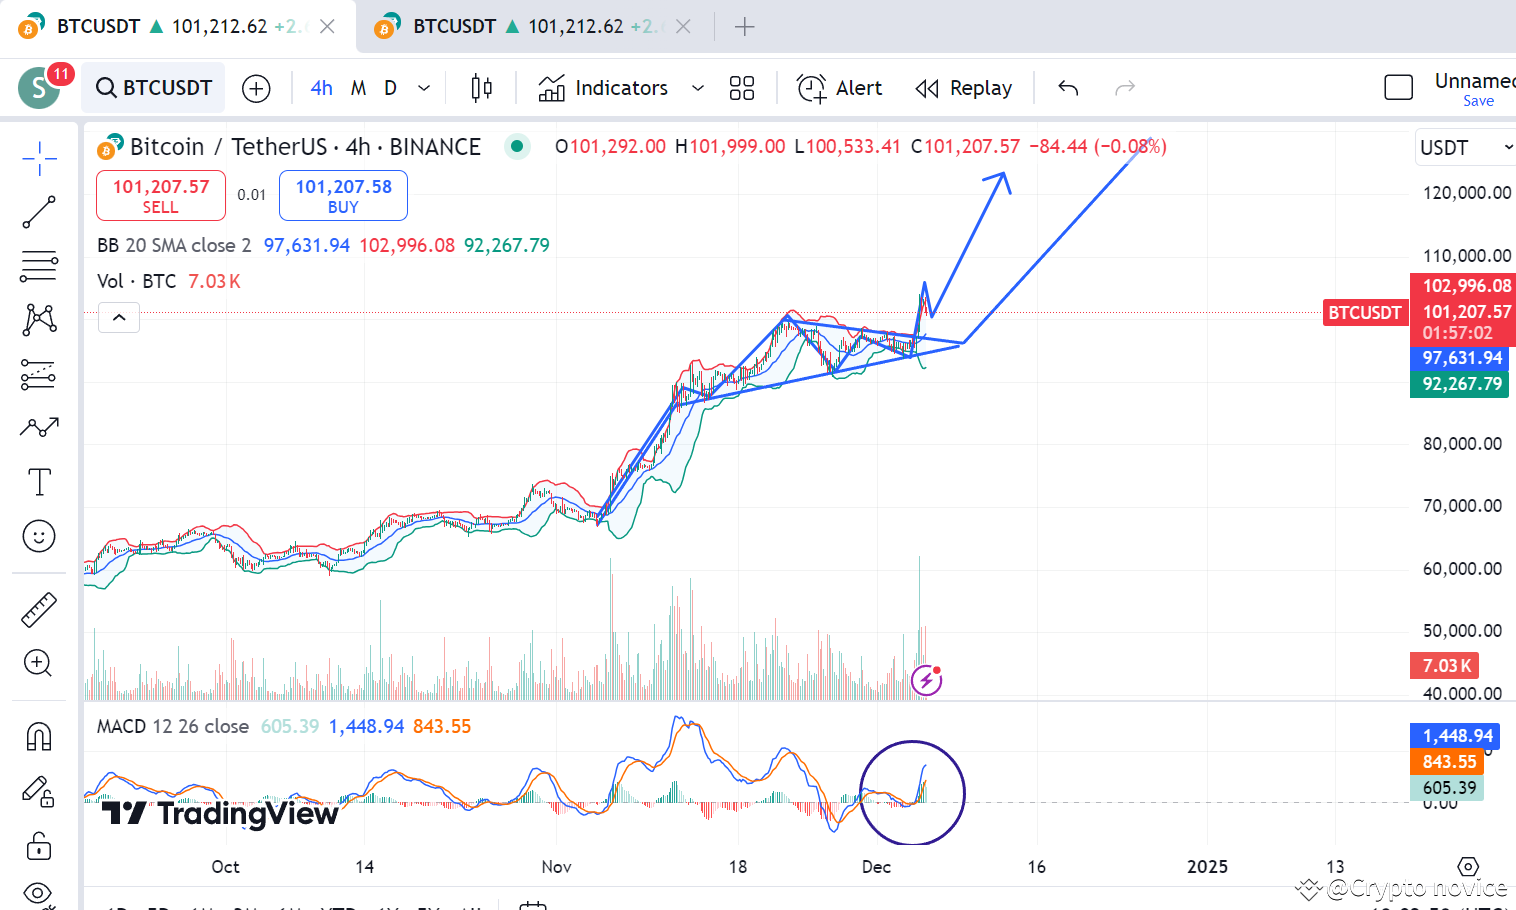
Bitcoin chart
We can see that Dominance has started falling down becoming Bearish. Why bearish? Because on Bollinger Bands it is coming down from resistance level becoming bearish. MA is also curving to downward direction . And most important on MACD it has started to over cross. Which means dominance is going to fall down. It is bearish.
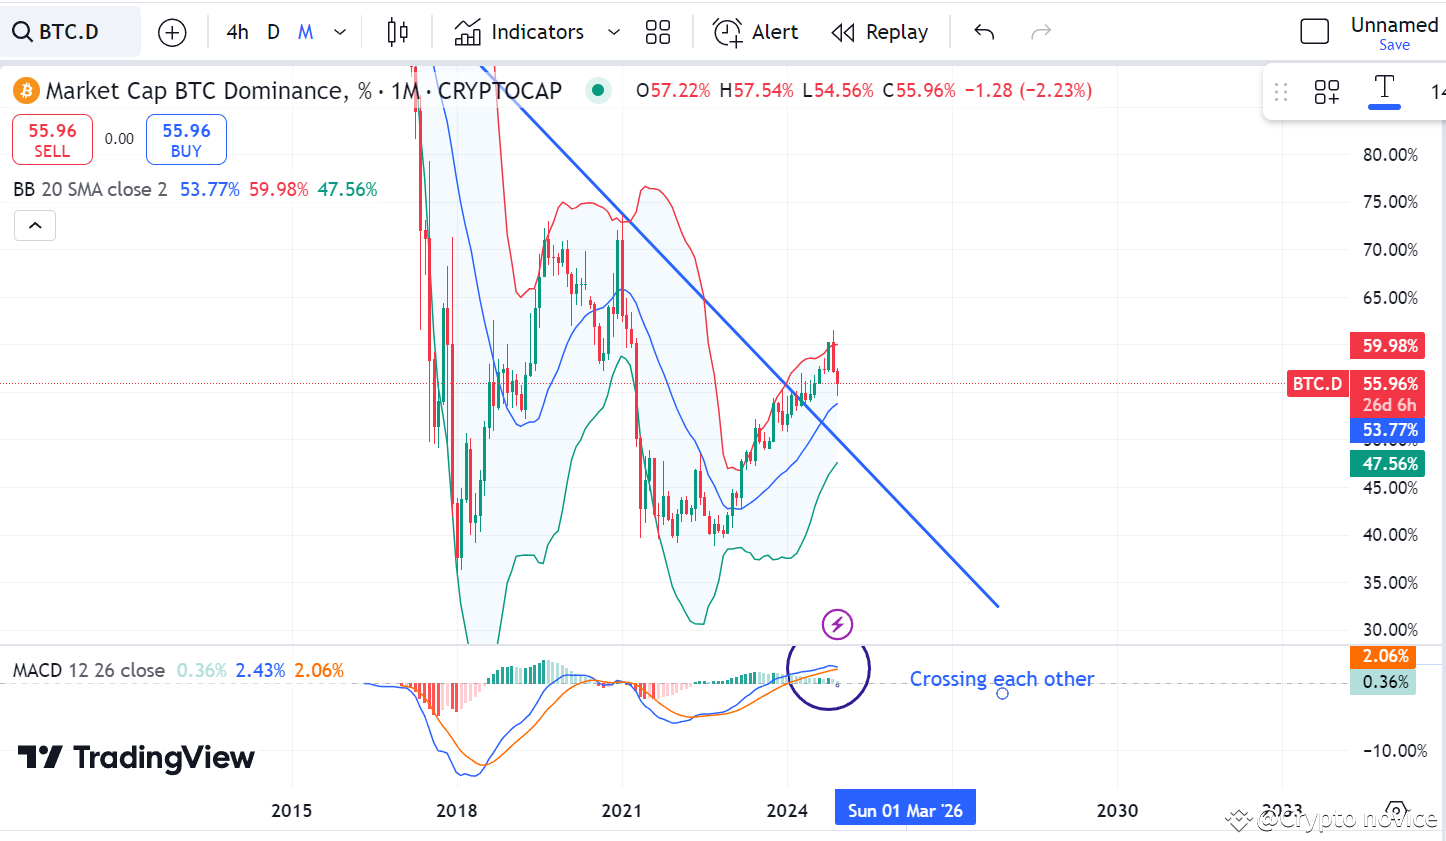
Bitcoin Dominance chart
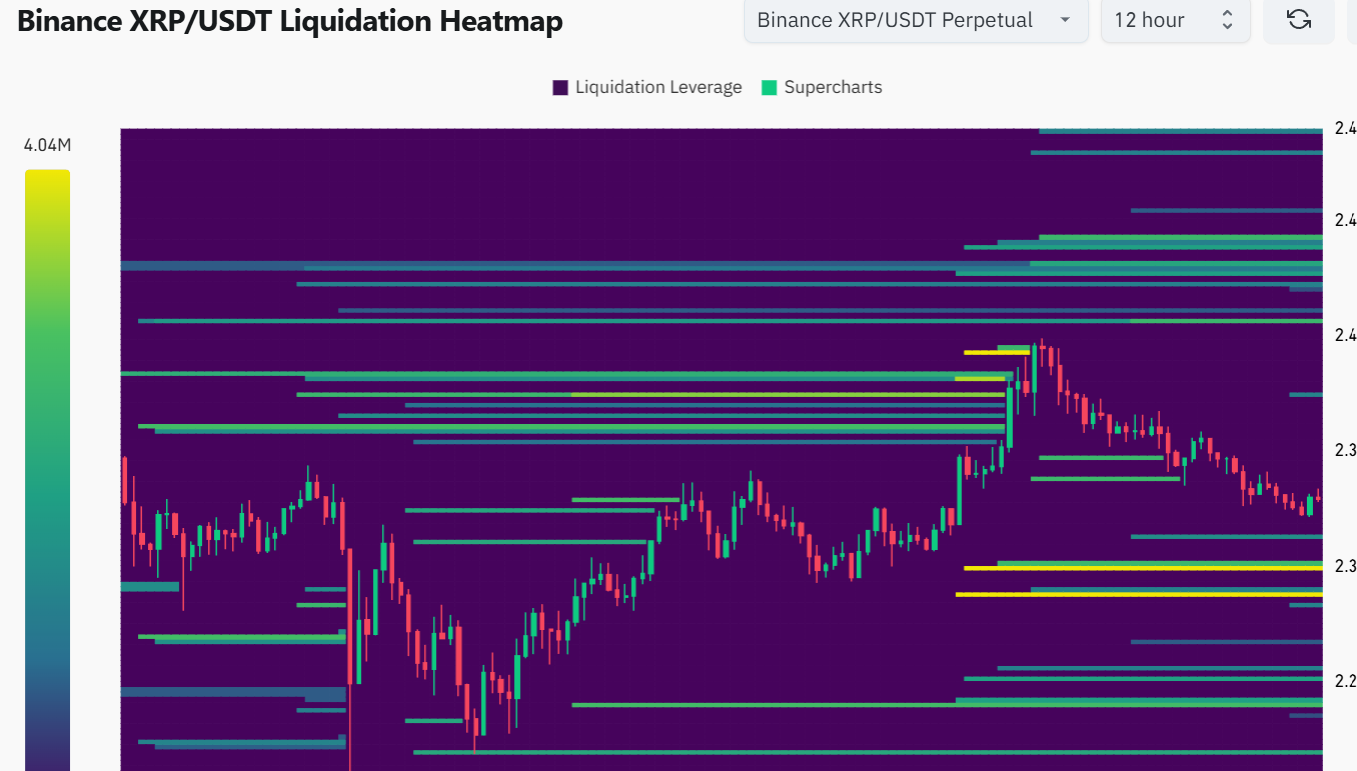
On heatmap we can also see that it is going down to grab short then it can go up but firstly it will go down.
👉JOIN MY LIVE FOR PREMIUM SIGNALS👈
Important note-
1) If you want to join my binance live stream click on my profile picture
2) We will send more than 2-3 signals for free.
