
Overall Trend:
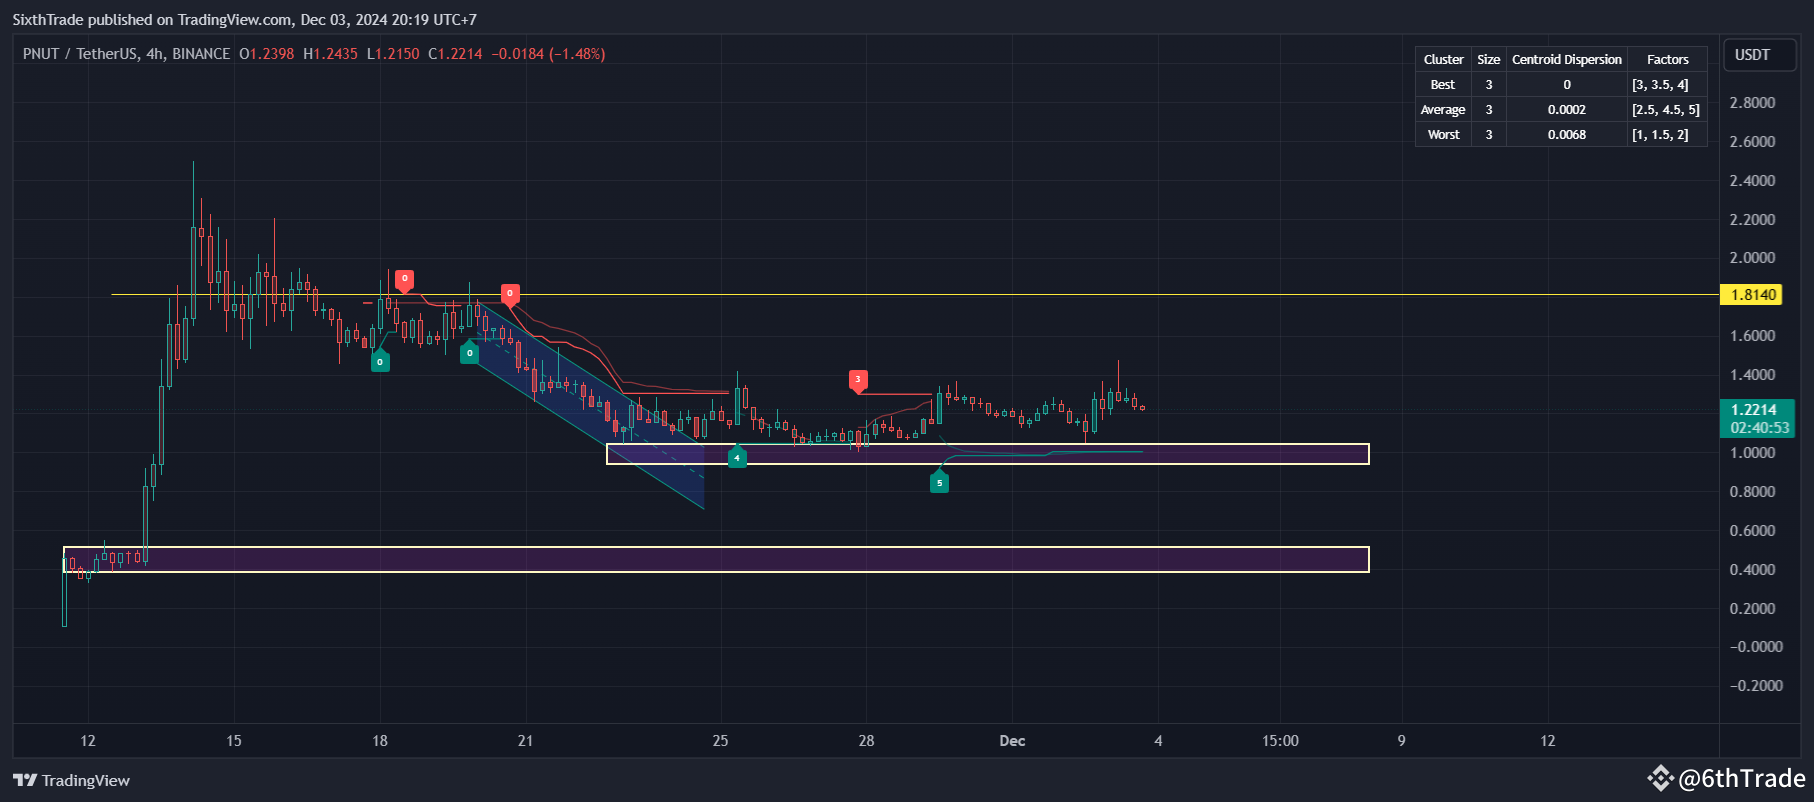
The price of PNUT/USDT is experiencing a consolidation phase, with relatively stable movement within a narrow range.
Support and Resistance Levels:
Immediate Support: $1.00
Immediate Resistance: $1.40
A breakout above or below these levels could indicate the next directional move.
Technical Indicators:
Moving Average (MA 200): The price is below the 200-period moving average, suggesting a bearish bias in the medium term.
Relative Strength Index (RSI): At 50.90, the RSI is in a neutral zone, indicating neither overbought nor oversold conditions.
MACD: The MACD line is slightly below the signal line, hinting at weak bearish momentum.
Cluster and Zone Analysis:
The highlighted cluster zones show significant price activity near $1.20–$1.40, representing short-term resistance.
Lower accumulation zones are around $1.00, indicating buying interest.
PNUT/USDT appears to be in a consolidation phase. Traders should watch for a breakout or breakdown from the $1.00–$1.40 range for confirmation of the next trend. Maintaining a cautious approach with appropriate stop-loss levels is recommended in the current range-bound market.