
Certain altcoins are expected to yield substantial returns. Identifying these promising tokens before they surge could be the key to acquiring significant wealth. The path to financial success may lie in discovering digital assets poised to perform excellently, especially ahead of exciting developments in the market before 2025.
ETH
Ethereum has recently experienced significant price volatility. In the past week, its price increased by 6.18%. Over the past month, it surged by 35.31%. However, over the past six months, ETH has declined by 6.47%.
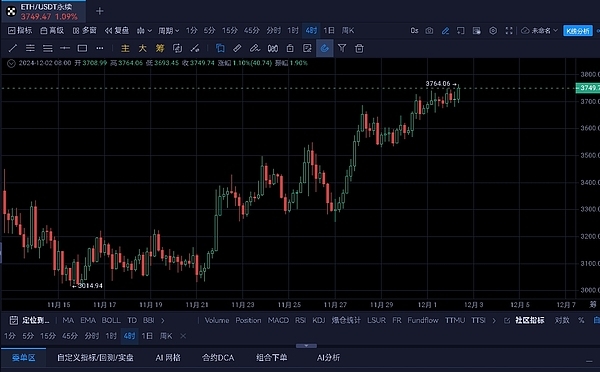
ETH is currently trading between $3740 and $3800. The Relative Strength Index is at 49, indicating neutral momentum. The MACD level is negative at -0.8452, suggesting potential bearish pressure.
XRP
In the past week, XRP (XRP) surged by 32.54%. Over the past month, it has increased by 213%, and in six months, it has risen by 218.85%. Currently, XRP is trading between $2.4 and $2.49, showing strong upward momentum.
The recent resistance faced by XRP is at $2.5, representing potential increases of approximately 15% and 50%. On the downside, the recent support level is at $0.80, with the second support level at $0.2199. Falling to the first support level would mean a drop of about 30%. Based on recent performance and technical data, XRP may continue its upward trend, but traders should closely monitor these key levels.
SOL
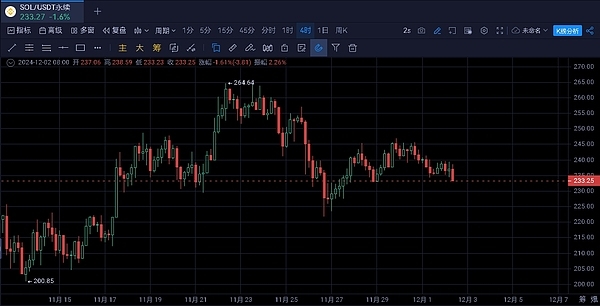
SOL's price has recently undergone significant changes. In the past week, its value dropped by about 6%, stabilizing between $233.27 and $268.25. Despite the short-term decline, the token's price surged over 34% in the past month and over 45% in the past six months, indicating strong long-term growth.
Technical indicators further insight SOL's performance. The Relative Strength Index (RSI) is at 57.87, indicating that the asset is neither overbought nor oversold. The 10-day and 100-day Simple Moving Averages (SMA) are close, at $240.24 and $237.54 respectively, reflecting stable momentum. The recent resistance level is at $283.64. Breaking this resistance level may lead SOL to drop to the second resistance level at $318.25. On the downside, the recent support levels are at $214.42 and $179.81, which may act as cushions if the price declines.
According to these data points, SOL has the potential for price increases. The significant rises over the past month and six months indicate upward momentum. If the price breaks through resistance levels, it may rise further. Conversely, a drop below support levels could signify a decline. Overall, Solana's recent performance and technical indicators suggest potential continued growth.
DOGE
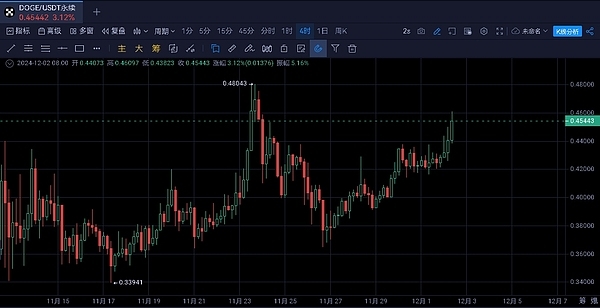
DOGE's price has recently changed significantly. In the past week, it has risen by 6.15%. Over the past month, the token surged by 133.48%. Looking at a six-month timeframe, the price has increased an astonishing 155.89%. Currently, Dogecoin is trading between $0.45 and $0.49.
Looking ahead, the recent resistance level is at $0.55. Breaking this could lead to the next resistance level at $0.67, approximately 37% higher than the current peak. On the downside, the recent support level is at $0.30, about 19% lower than the current low. The second support level is at $0.18, which is significantly lower. These support and resistance levels are crucial for traders focusing on the potential growth of Dogecoin.