
BTC/USDT Trend Analysis
1. Uptrend Direction:
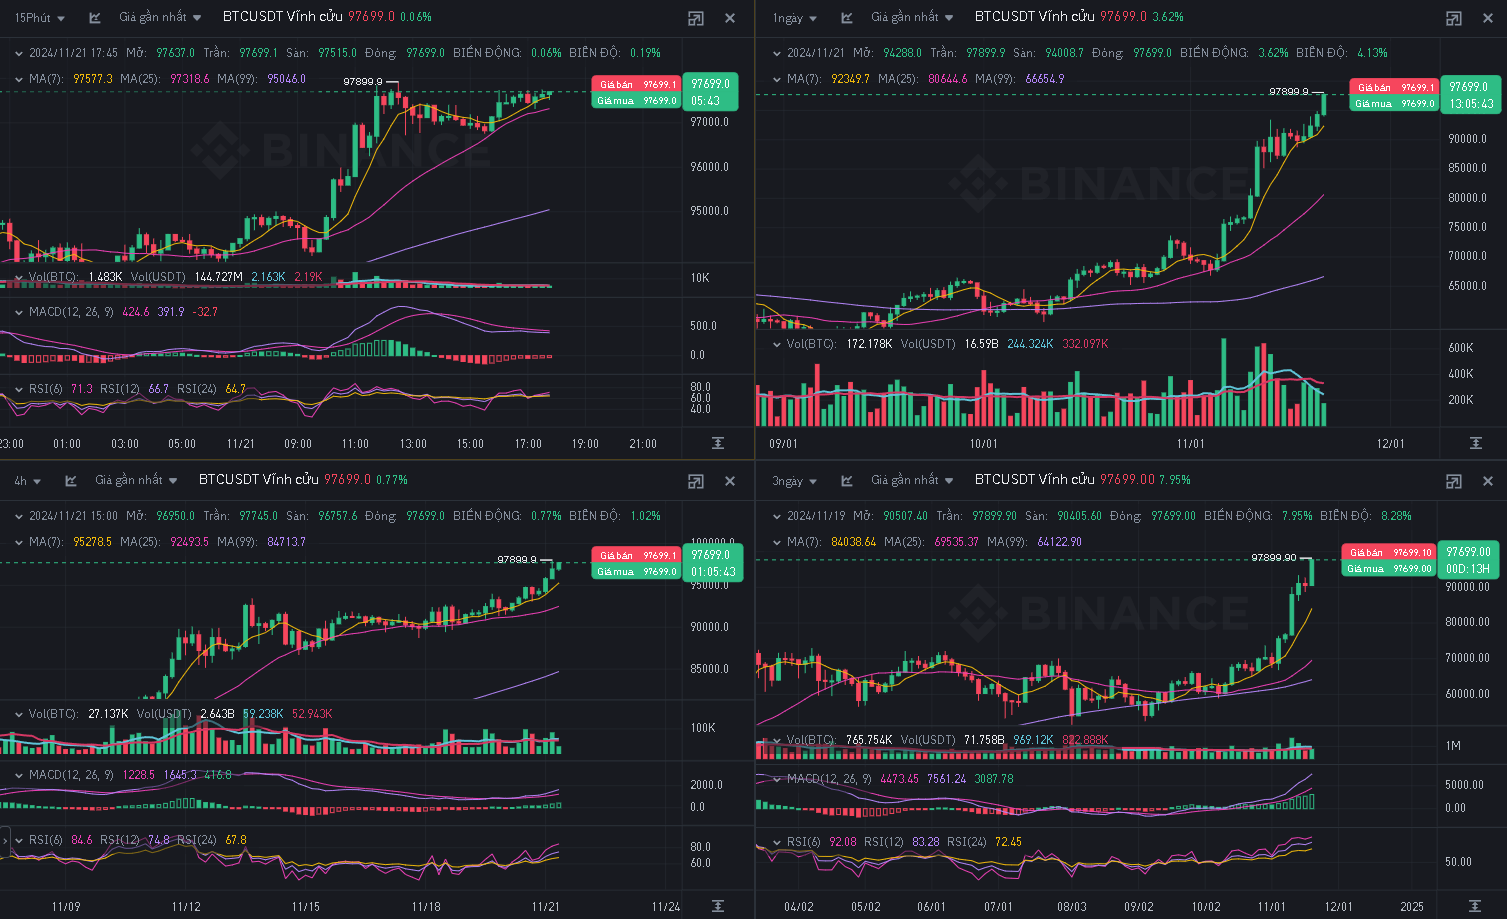
Short-term timeframe (15 minutes, 4 hours):
MACD: Clear bullish signal with positive histogram, MACD line crossing above Signal line. Strong upward momentum.
RSI: Fluctuating above 65 (buy zone), indicating that the upward trend may continue but could be overbought.
Volume: Increasing significantly, confirming market interest.
Long reference price: 97,000 - 97,500 USDT with target 99,000 - 100,000 USDT.
Warning: Set stop-loss at 96,000 USDT.
Long-term timeframe (1 day, 3 days):
MACD: Strong upward trend with growing histogram.
RSI: Entering overbought territory (around 72-80), indicating a short-term peak may occur.
Volume: Transaction volume steadily increasing, reinforcing long-term upward momentum.
Long reference price: Buy around the 95,000 - 96,000 USDT zone with long-term target of 105,000 USDT.
2. Downtrend Direction:
Short-term timeframe:
If RSI turns down below 50 and MACD crosses below Signal, the price may break the support zone of 96,000 USDT.
Short reference price: 96,000 USDT with target 93,000 - 92,000 USDT.
Warning: Volatility may increase significantly, tight risk management is needed.
Long-term timeframe:
The price may test important support in the 90,000 USDT zone if RSI drops deep below 60 and MACD turns negative.
Short reference price: Sell at the 93,000 USDT zone with a target of 85,000 USDT.
Warning:
The above analysis is for reference only and is not financial advice. Careful consideration and capital management are needed when trading in the Futures market.
