
BNB/USDT market analysis
Uptrend
Short term:
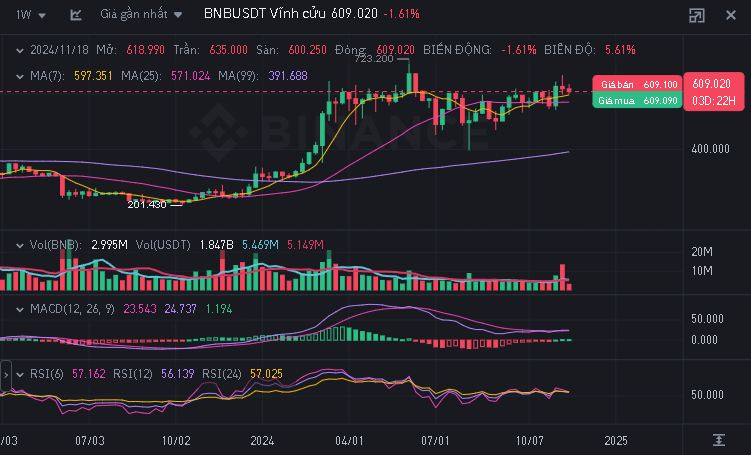
RSI: Current RSI is around 57, in the neutral zone but leaning towards an uptrend.
MACD: The MACD line is above 0, indicating that bullish momentum is still present.
Long position:
Reference price: Buy in the support zone $590 - $600.
Target: $630 - $650.
Long term:
RSI: If RSI rises above 60, the long-term uptrend may become more pronounced.
Long position:
Wait for the price to adjust to $580 to accumulate.
Target: $680 - $700.
Downtrend
Short term:
RSI: RSI is at a neutral level, but if it drops below 50, it may signal increasing selling pressure.
MACD: The MACD line shows signs of gradually weakening, needs to be monitored if it crosses down the signal line.
Short position:
Reference price: Sell in the range $620 - $630.
Target: $580 - $570.
Long term:
RSI: If RSI drops below 45, the long-term downtrend will be stronger.
Short position:
Reference price: Sell at $610 - $620.
Target: $540 - $550.
Warning:
The BNB/USDT chart is fluctuating in a narrow range, the overall trend needs additional signals for confirmation.
This is only a reference analysis, not financial advice. Always apply risk management strategies.