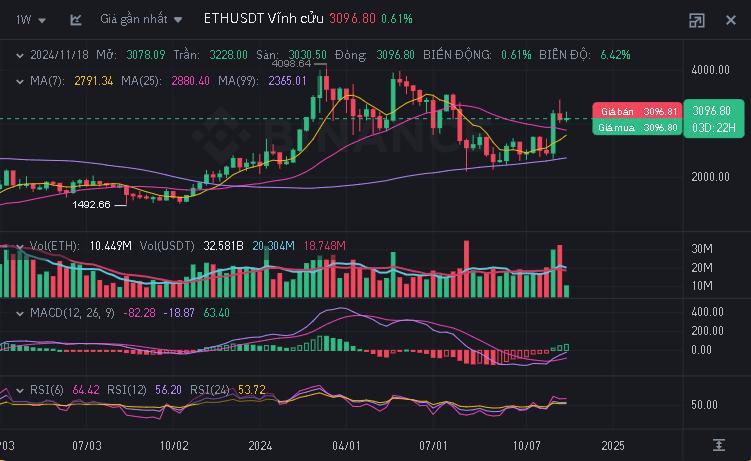
Based on the ETH/USDT chart you provided, here is a detailed analysis:
Analysis of Uptrend
Short Term:
RSI: The RSI index is around 56, indicating that the market has room for upward movement but is not overbought.
MACD: The MACD line is crossing above the signal line, supporting an uptrend.
Long Position:
Reference Price: Buy in the support zone of $2,950 - $3,050.
Target: $3,200 - $3,400.
Long Term:
RSI: With RSI close to 60, the uptrend still has potential to extend over a longer time frame.
Long Position:
Reference Price: Wait for the price to adjust to the range of $2,700 - $2,800.
Target: $3,500 - $4,000.
Analysis of Downtrend
Short Term:
RSI: If RSI drops below 50, it could trigger a downtrend.
MACD: If the MACD starts to cross below the signal line, that is a warning sign of a downturn.
Short Position:
Reference Price: Sell in the range of $3,200 - $3,250.
Target: $3,000 - $2,900.
Long Term:
RSI: The long-term downtrend will be more evident if RSI breaks below 50.
Short Position:
Reference Price: Sell at $3,100 - $3,200.
Target: $2,500 - $2,600.
Warning:
The market may experience significant volatility, be sure to manage risks.
This is just a reference analysis and not financial advice. Do not trade if you do not have a clear capital management plan.
