
Coin name: $GTC
Short
Price: 0.671
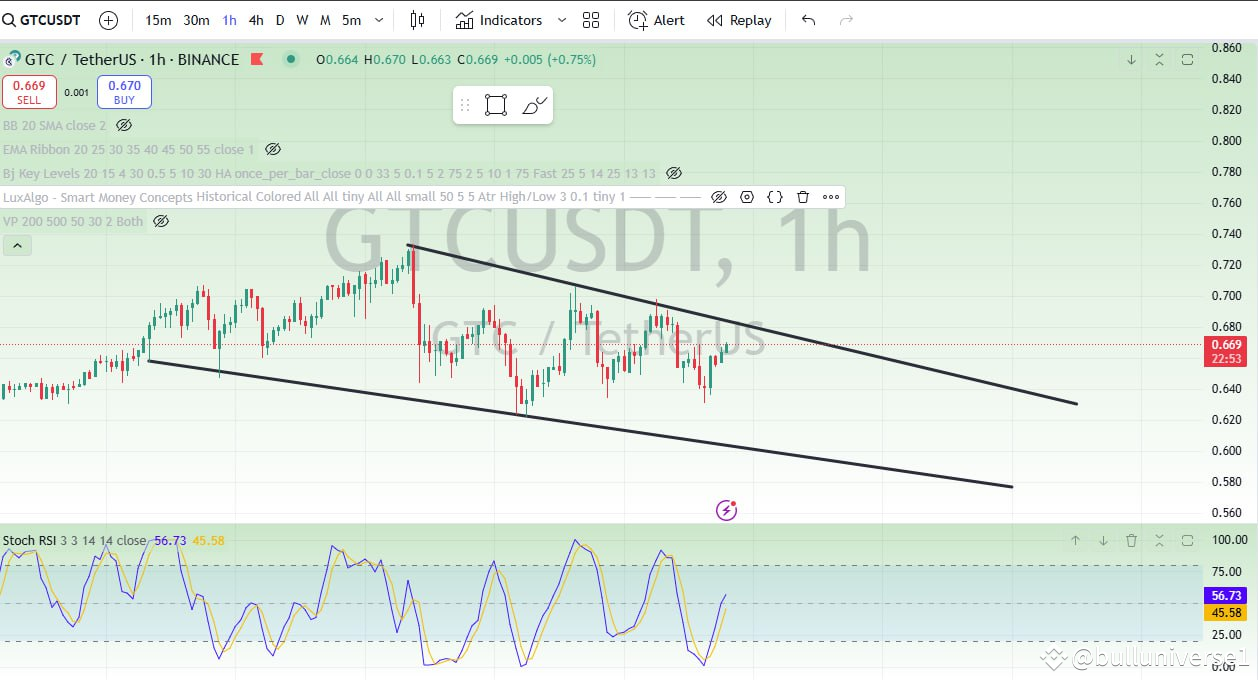
Here is cans see a bull flag bullish chart 📊 pattern now GTC technically will go down from upper resistance trendline.
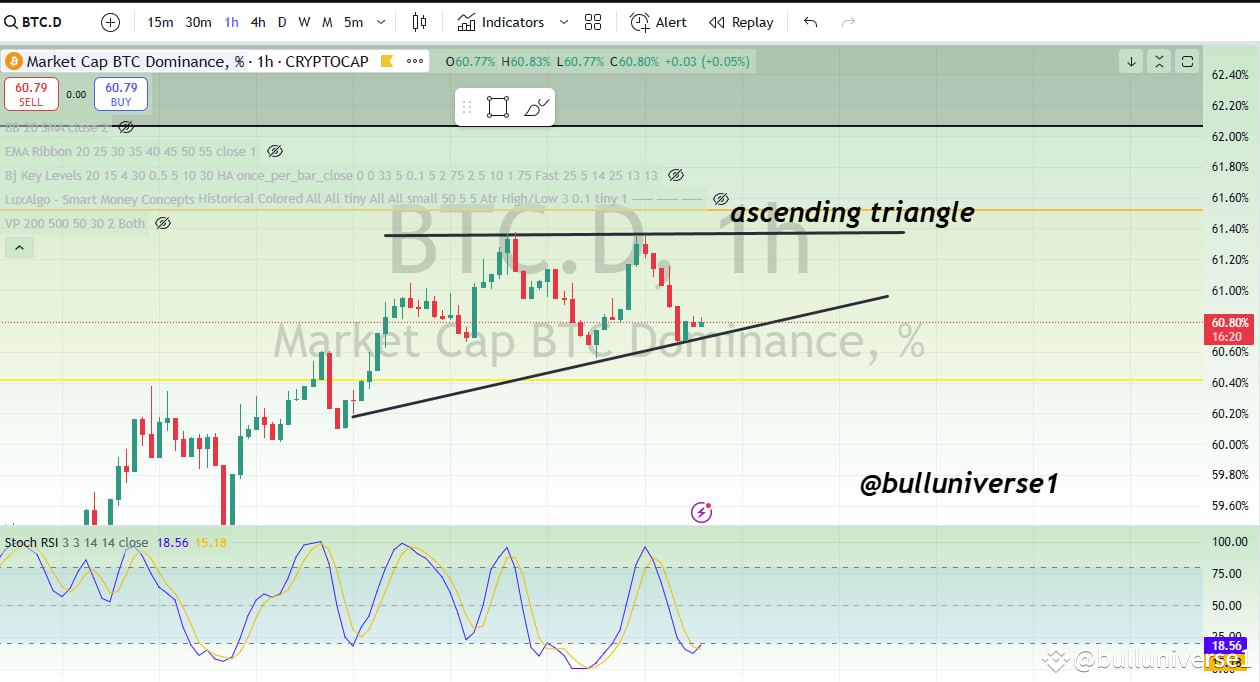
Btc.d in 1h time frame I can see a bullish chart pattern so alts will go down 👇 technically otherwise alts movement will be slow in this current situation. Btc is strong now but alts not. If btc.d breakdown alts will pump hard
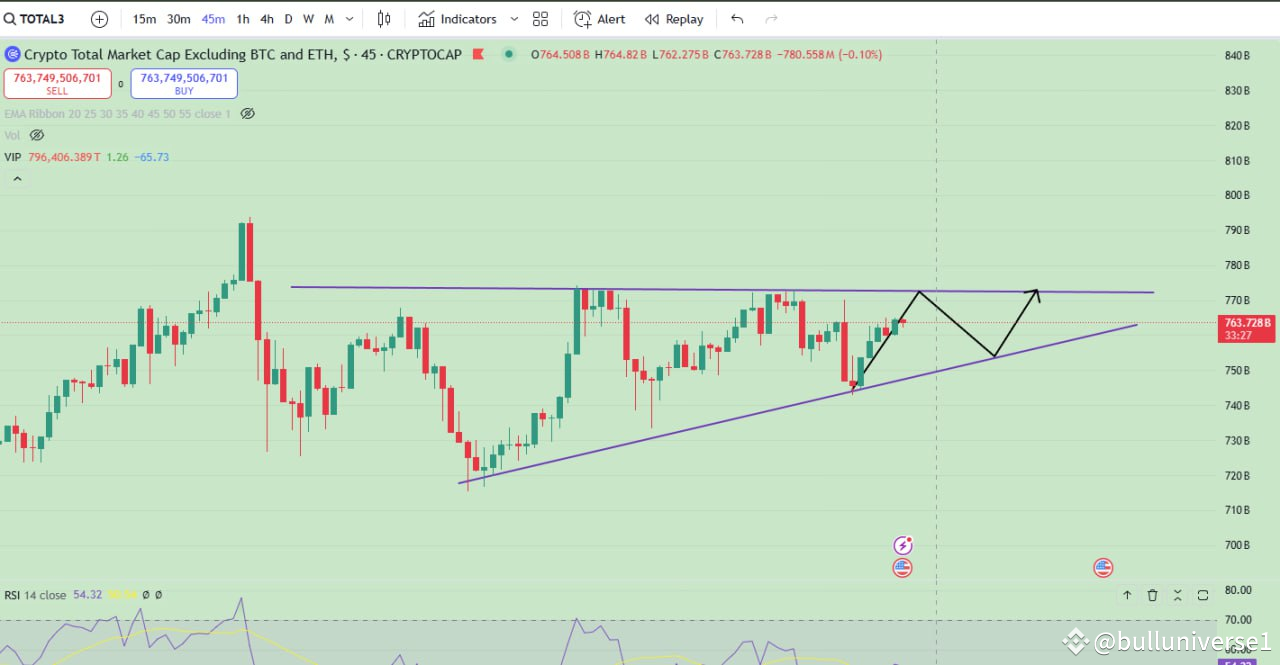
Total 3 also have consulted ascending triangle pattern so money flow index now looks bearish so alts will go down technically.
10x leverage isolated
Sl: 0.7000
Target:
1) 0.650
2)0.625
3)0.600
Get daily new signals like this (2-4 signals per day) by following these simple steps:
Join my Binance LIVE for more information and signals update

