
Here is a complete explanation of some popular chart patterns in technical analysis: Descending Triangle, Ascending Triangle, Symmetrical Triangle, and Symmetrical Expanding Triangle. Each of these patterns has unique characteristics that can provide price movement signals for traders. Here is an explanation, how to read the patterns, strategies for opening and closing positions, and additional tips.
1. Descending Triangle
Description:
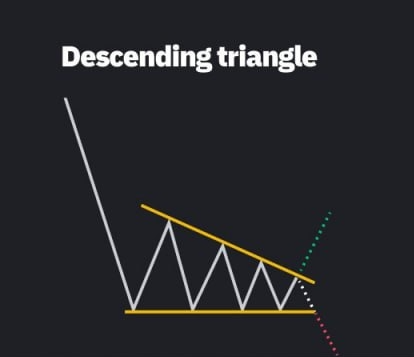
Descending Triangle is a bearish chart pattern consisting of a horizontal support line below and a descending resistance line above. This pattern indicates increasing selling pressure, which could lead to a breakout of support and further price declines.
How to Read:
- Horizontal support lines represent areas that are frequently tested but difficult to break through.
- A descending resistance line indicates that the price is getting lower every time it tries to move up.
Open Position:
- A sell position can be opened when the price breaks through the support line, as this indicates a potential continuation of the downtrend.
- Wait for confirmation of increasing volume after the breakout as a sign of a valid breakout.
Close Position:
- Closing a sell position can be done when the price reaches a new support area, or when there are strong signs of a reversal.
- Set a stop-loss above the last resistance line to protect against a price reversal.
Additional Tips:
- Beware of false breakouts, especially on low volume charts.
- Descending Triangle is stronger in a previous downtrend and is more accurate when volume decreases as price approaches support.
2. Ascending Triangle
Description:
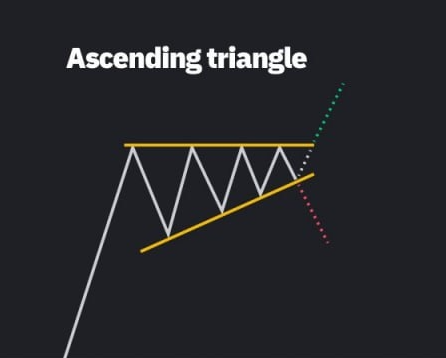
An Ascending Triangle is a bullish pattern that has a horizontal resistance line above and an ascending support line below. This pattern often appears in the middle of an uptrend and indicates increasing buying pressure.
How to Read:
- The horizontal resistance line shows that the price level is difficult to break, but upward attempts continue to be made.
- The rising support line indicates that buying pressure is getting stronger.
Open Position:
- Buy positions can be opened when the price successfully breaks through the horizontal resistance line.
- Make sure volume increases during the breakout to confirm signal strength.
Close Position:
- Buy positions can be closed when the price reaches a higher resistance target or in the overbought area.
- Stop-loss can be placed below the last support line.
Additional Tips:
- This pattern is ideal for trading during an existing uptrend.
- Decreased volume as price approaches the top of the Ascending Triangle could indicate an impending breakout.
3. Symmetrical Triangle
Description:
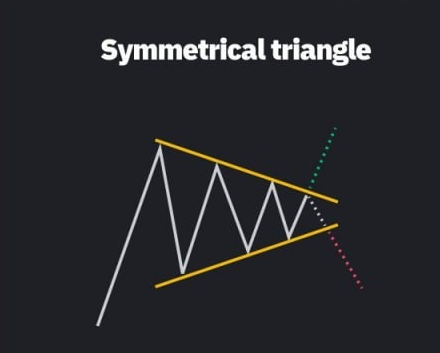
Symmetrical Triangle is formed when the resistance line decreases and the support line increases symmetrically. This pattern is a neutral pattern and can produce a breakout to the upside or downside, depending on the dominant buyer or seller pressure.
How to Read:
- This pattern is formed during consolidation, when the price moves with lower highs and higher lows.
- A breakout to the upside indicates a bullish signal, while a breakout to the downside is a bearish signal.
Open Position:
- Positions can be opened when the price breaks through one side of the pattern with strong volume.
- If the price breaks out upwards, open a buy position; if it breaks out downwards, open a sell position.
Close Position:
- Close the position in the direction of the breakout after the profit target is reached or there are signs of reversal.
- Stop-loss is placed around the opposite side of the last support or resistance line.
Additional Tips:
- Avoid entering positions before there is a clear breakout.
- Tapering volume during the formation of the pattern can signal an imminent breakout.
4. Symmetrical Expanding Triangle
Description:
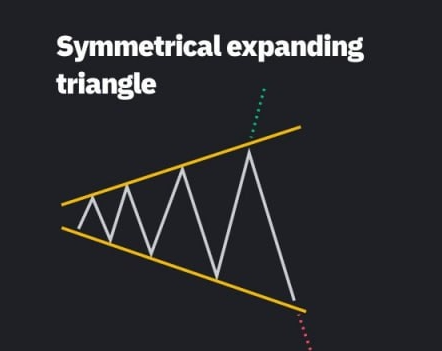
Symmetrical Expanding Triangle, or expanding triangle pattern, is a pattern formed with support and resistance lines that are increasingly far apart. This pattern indicates increasing price volatility over time.
How to Read:
- Wider support and resistance lines indicate instability and potential price reversals.
- Usually formed when there is a large difference in the power of buyers and sellers.
Open Position:
- Traders generally enter positions after price breaks out of the pattern's support or resistance line.
- For this pattern, open positions should be more careful because the expanding triangle pattern tends to be unstable.
Close Position:
- Close the position in the direction of the breakout after reaching the profit target or if the pattern starts to lose momentum.
- Place a stop-loss beyond the furthest point of the pattern to protect against wild moves.
Additional Tips:
- Be aware of increased volatility while this pattern is forming.
- Expanding Triangles appear more often in volatile markets or when there is major news.
Conclusion
Triangle patterns on the price chart can provide strong signals for taking a position. Here are some additional tips to deepen your understanding of these patterns:
1. Confirmation Volume: Increasing volume after a breakout can strengthen the signal. The higher the volume, the stronger the likelihood of a significant move.
2. Previous Trend: These patterns are usually more accurate when identified within a clear trend. Ascending and Descending Triangle patterns will be more appropriate within existing uptrends and downtrends.
3. Risk Management: Using stop-loss is important to protect capital from unexpected movements.
Understanding the characteristics and breakout signs of each pattern can help improve trading accuracy and profitability in technical analysis.


