Actually, I didn't want to write this article. If my analysis is wrong, I will admit it. If it's not wrong, I don't understand why you are scolding me. Are you trying to make yourself known or are you deliberately attracting negative comments? If you can't accept my way of doing things, just ignore me and block me. After that, I will admit it. If you come here to attract negative comments for no reason, I will ignore you. Just block you.
When placing an order or waiting for the right side pattern to do it, it must be the most stable operation method, combining the left and right sides, but some brothers or some old leeks brothers who have been in the circle for a long time have been losing money, or have been operating randomly and can't understand the market trend. I thought about it for a long time and taught you some practical things that can really make money. It is better to teach a man to fish than to give him a fish!
Cycle and Level
When you wake up and want to check the market or make an operation, the first task is to determine the cycle. The first problem for novices entering the circle is that they don’t know how to choose the level cycle.
Let me tell you that the first thing is to look at the daily line. Look at the daily line at the closing at 8 o'clock in the morning. The daily line covers the trend of the whole day of yesterday. If it closes with a negative line, a positive line or a doji, it can help you roughly judge whether today's trend is likely to rise or fall.
After you have a rough idea of what to expect after looking at the daily chart, look at the four-hour chart. I said during the live broadcast that the four-hour chart is the most stable and the pattern it produces is the most certain, which means that at the four-hour chart you can use the theories or patterns, indicators, etc. that you know to analyze.
Misconception: Abandon the bad habit of looking at the 15-minute K-line and look at the chart
 This chart is at the 15-minute level. I would like to ask, what help do such a K-line with long upper and lower shadows give you in terms of naked K or morphology? Not at all.
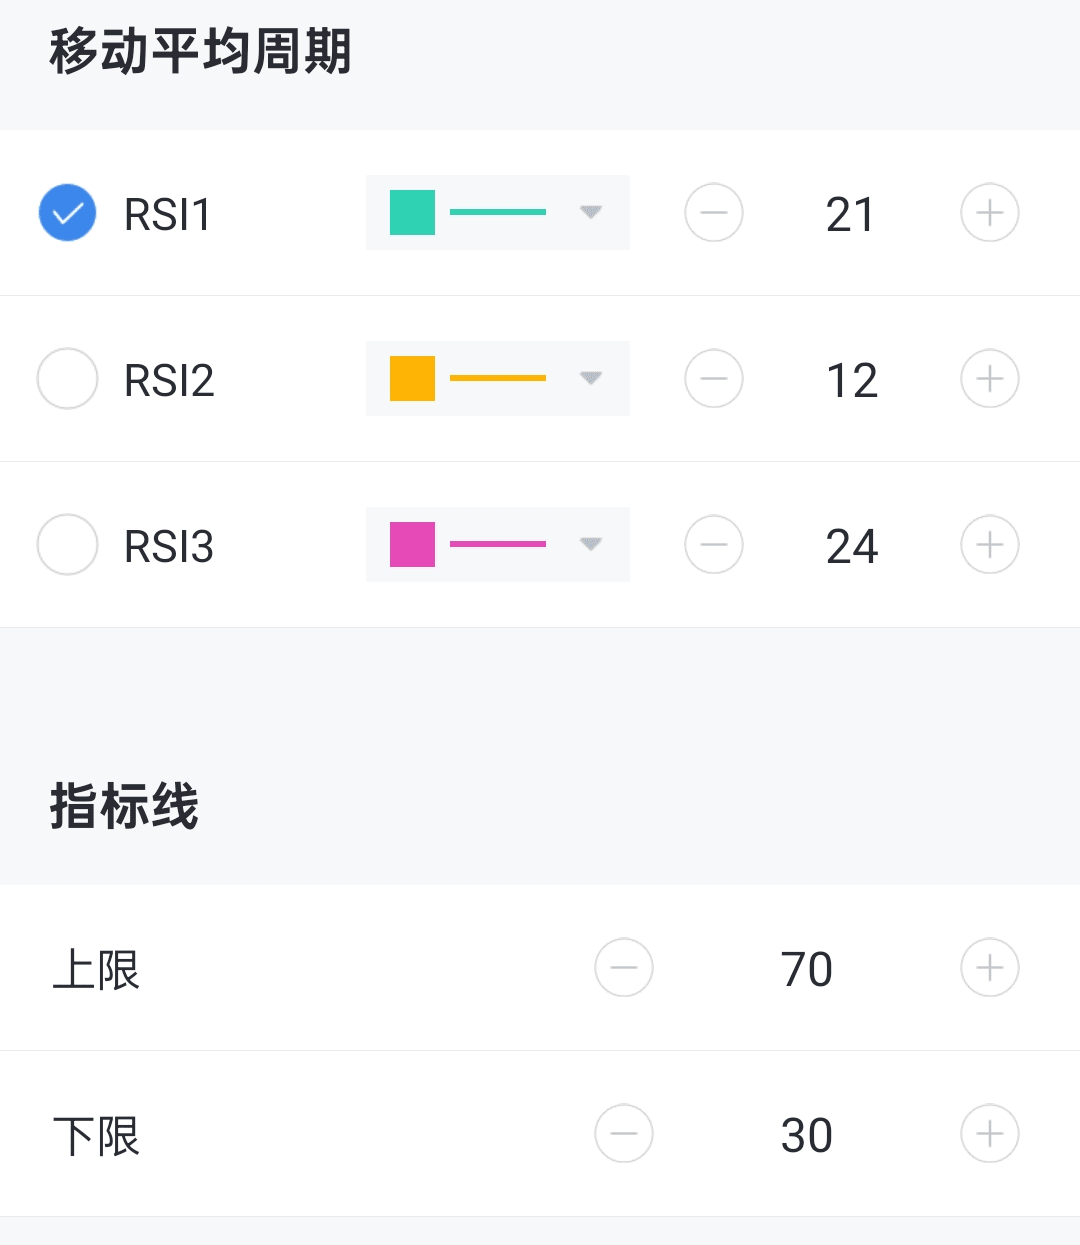
Technical indicator 1: RSI's extreme overbought and oversold range can help you make quick profits in special market conditions, with a profit probability of 75% or more. First, let me show you my own RSI settings (I don't want to give you this parameter, why? Because it's useful, I thought about it and shared it without reservation)
 In what situations can the RSI indicator be used to make quick profits, extreme overbought and oversold levels. See the picture
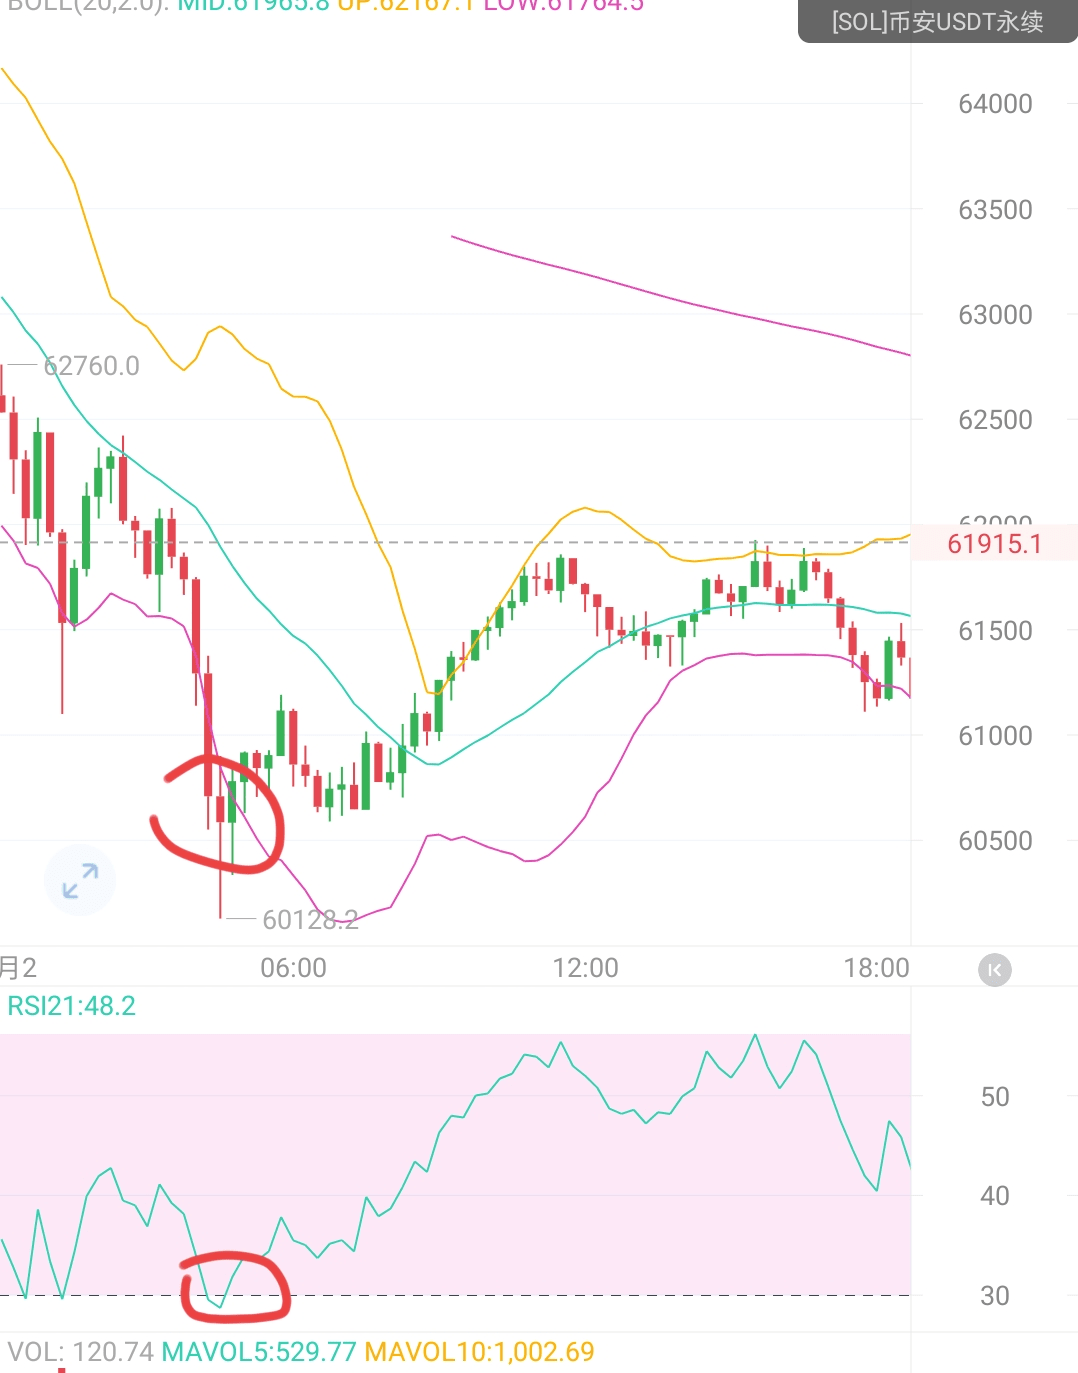
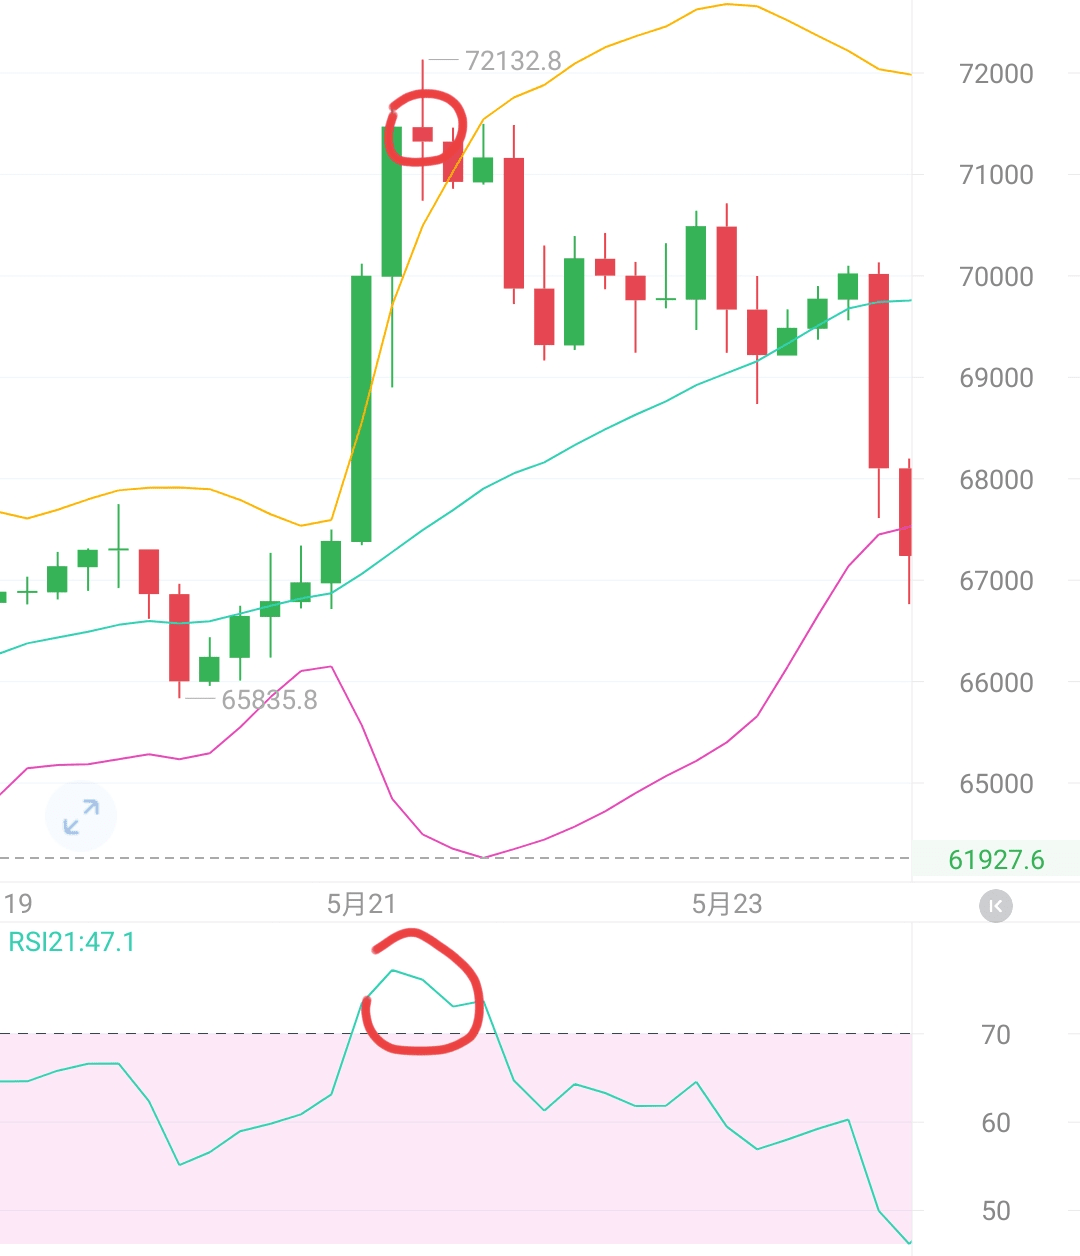
When the price is overbought and above RSI70, you should pay attention that it has reached the extreme overbought range. The subsequent indicators will definitely or most likely be corrected, and the price will show a downward correction.
When the RSI is oversold to below 30, you should note that the RSI has reached the extreme oversold range, and the indicator is likely to be repaired upwards, and the price will show an upward correction. (Note that I said extreme oversold and overbought, not ordinary overbought and oversold) Here, using naked K to assist has a higher winning rate!
Technical indicator 2: Bollinger Bands plus moving average strategy
I'll show you my parameters.
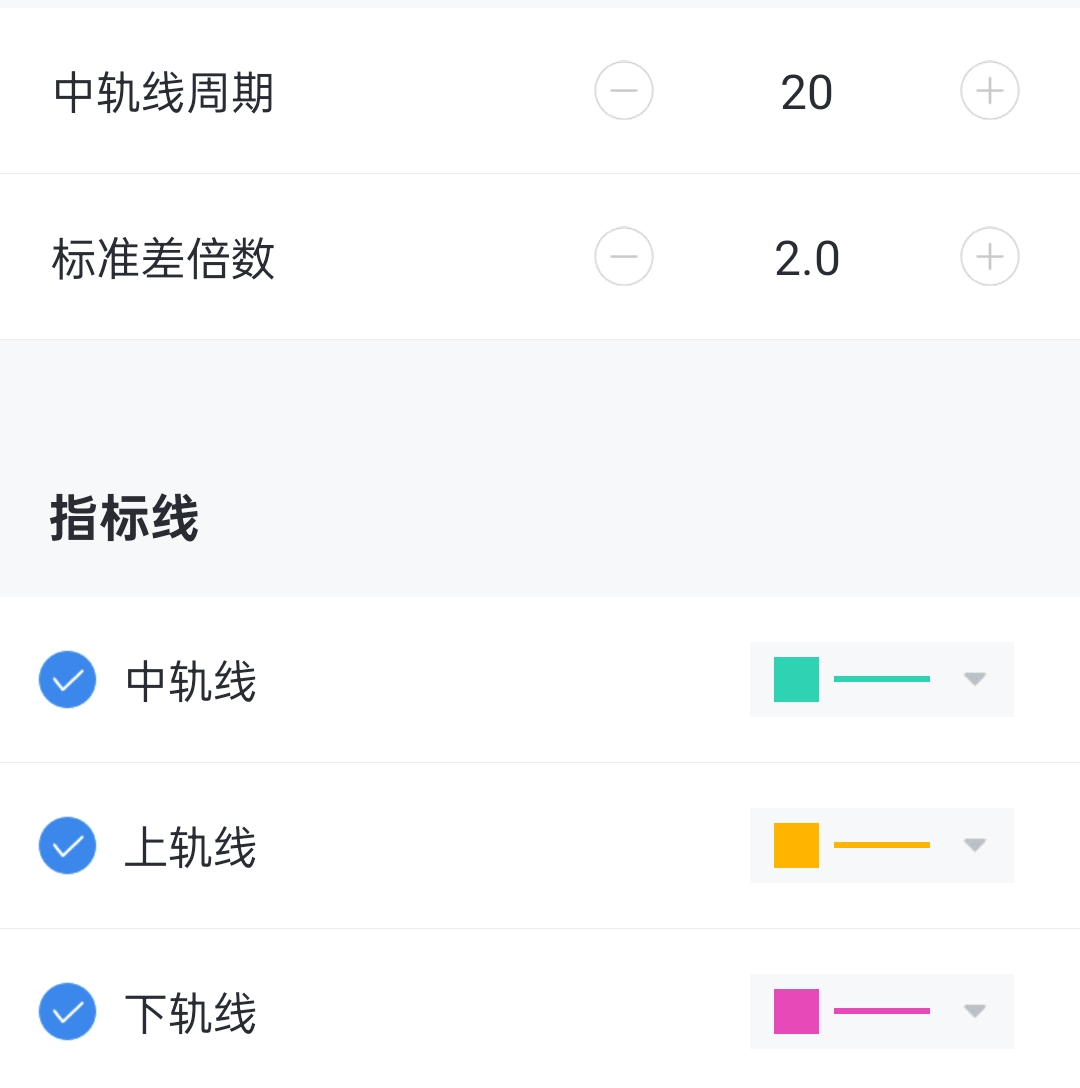
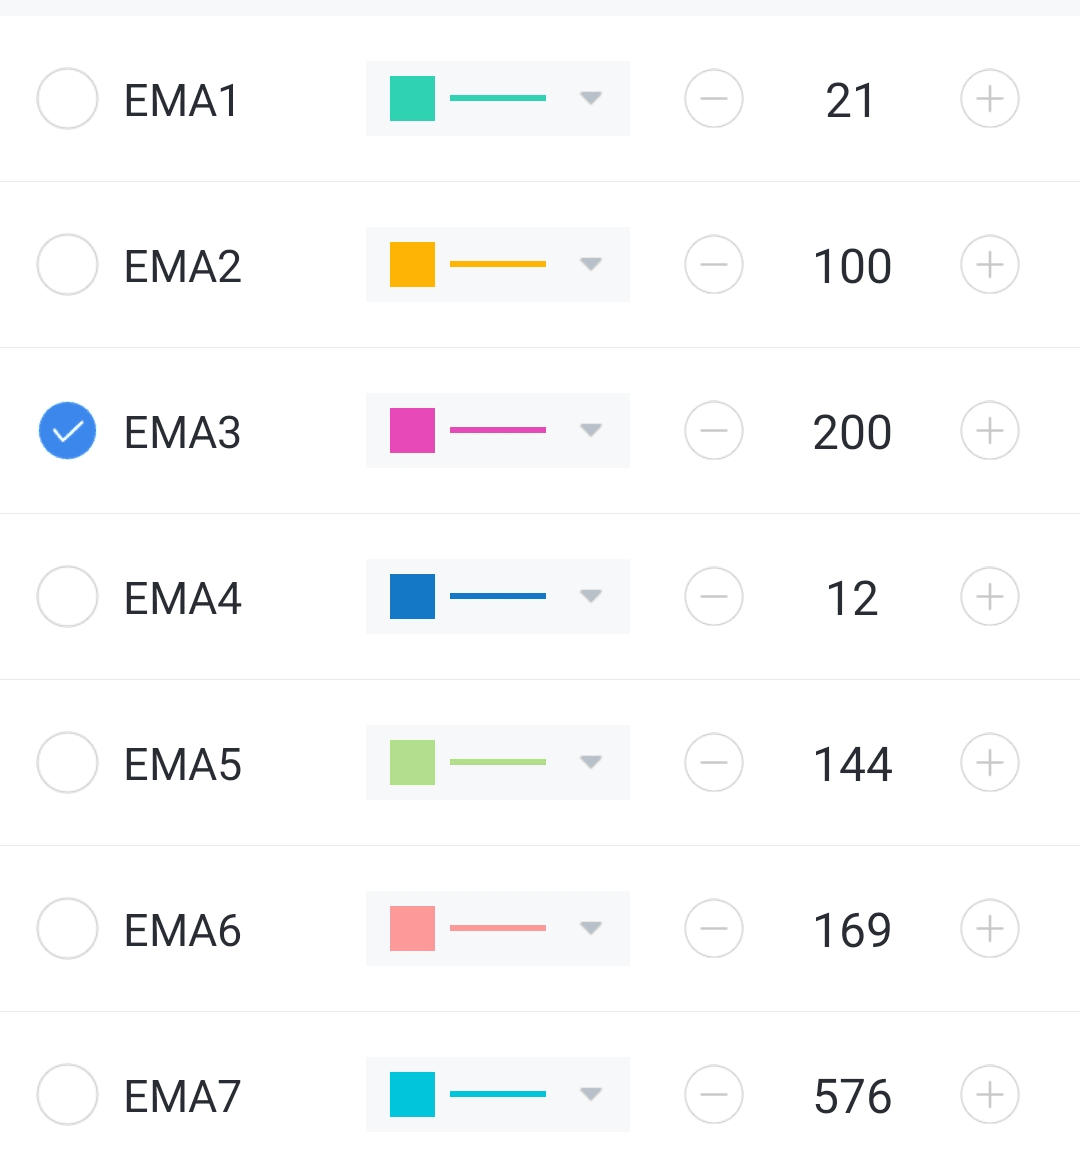
How to use or how to operate it?
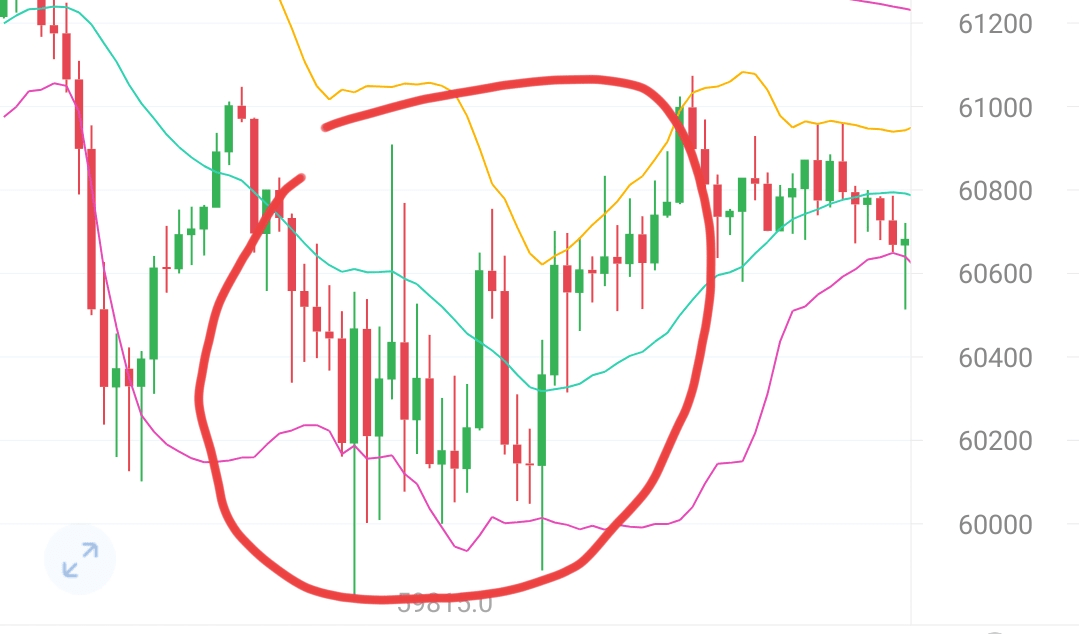
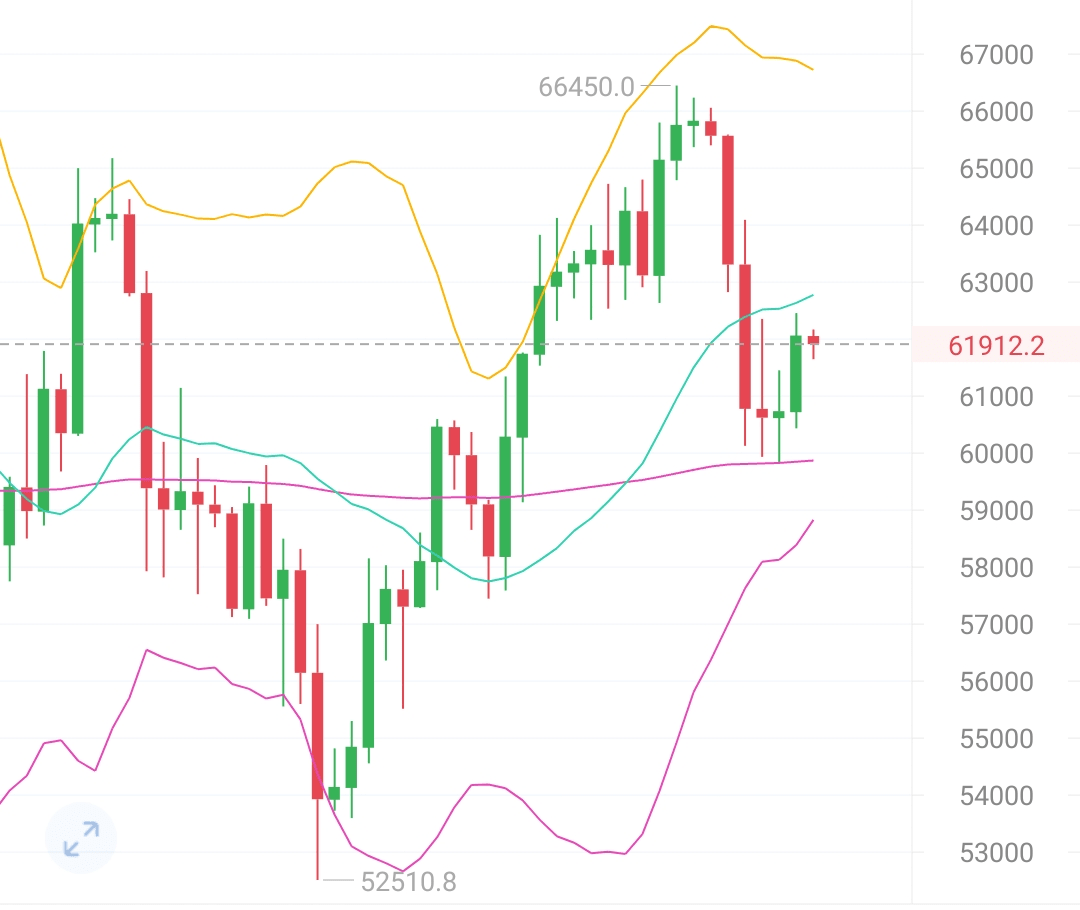
When the overall price is above the EMA200 daily moving average, the overall trend is bullish. When the overall price is below the EMA200 daily moving average, the overall trend is bearish. In the bullish case, when the price falls back to the boll line, go long and never go short. In the bearish case, when the price goes up to the upper track of the boll line, go short and never go long. See the picture
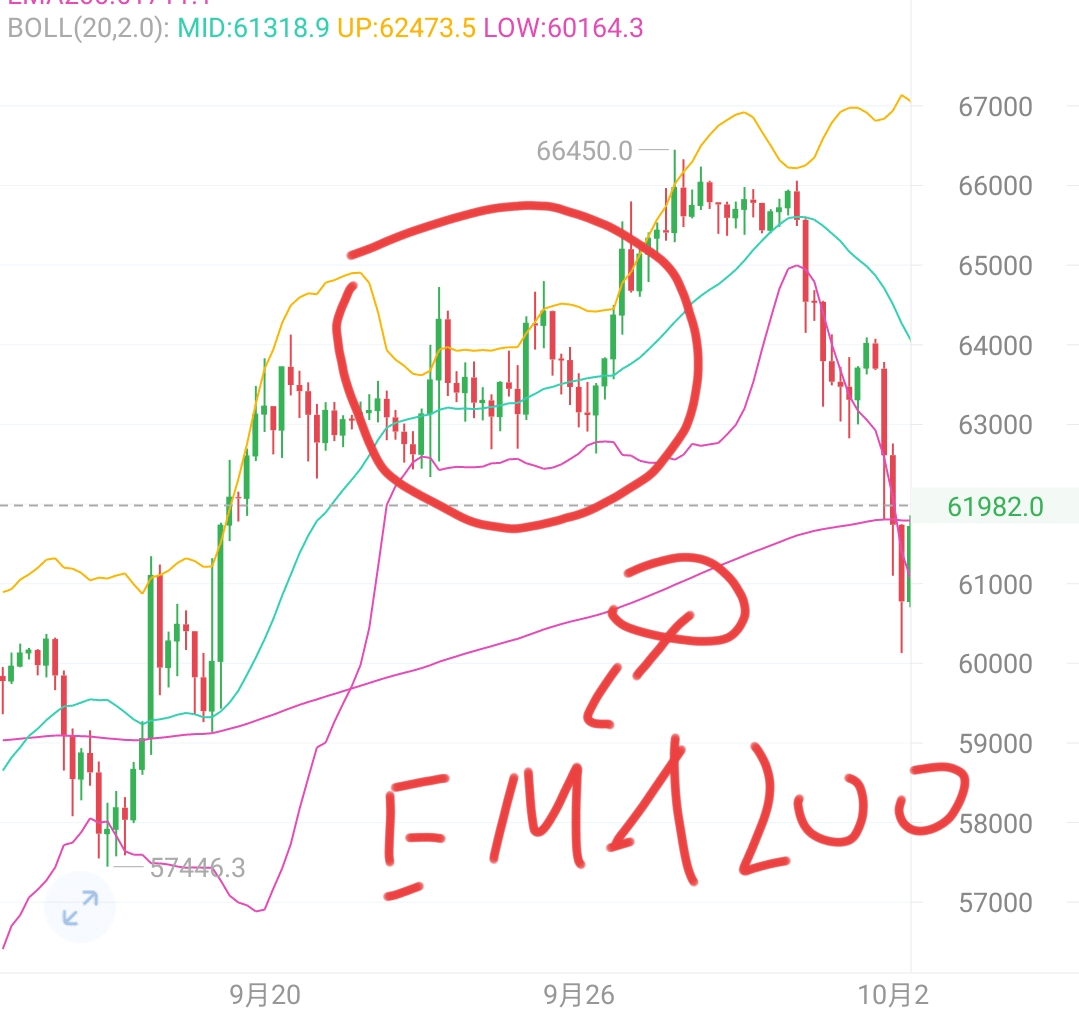
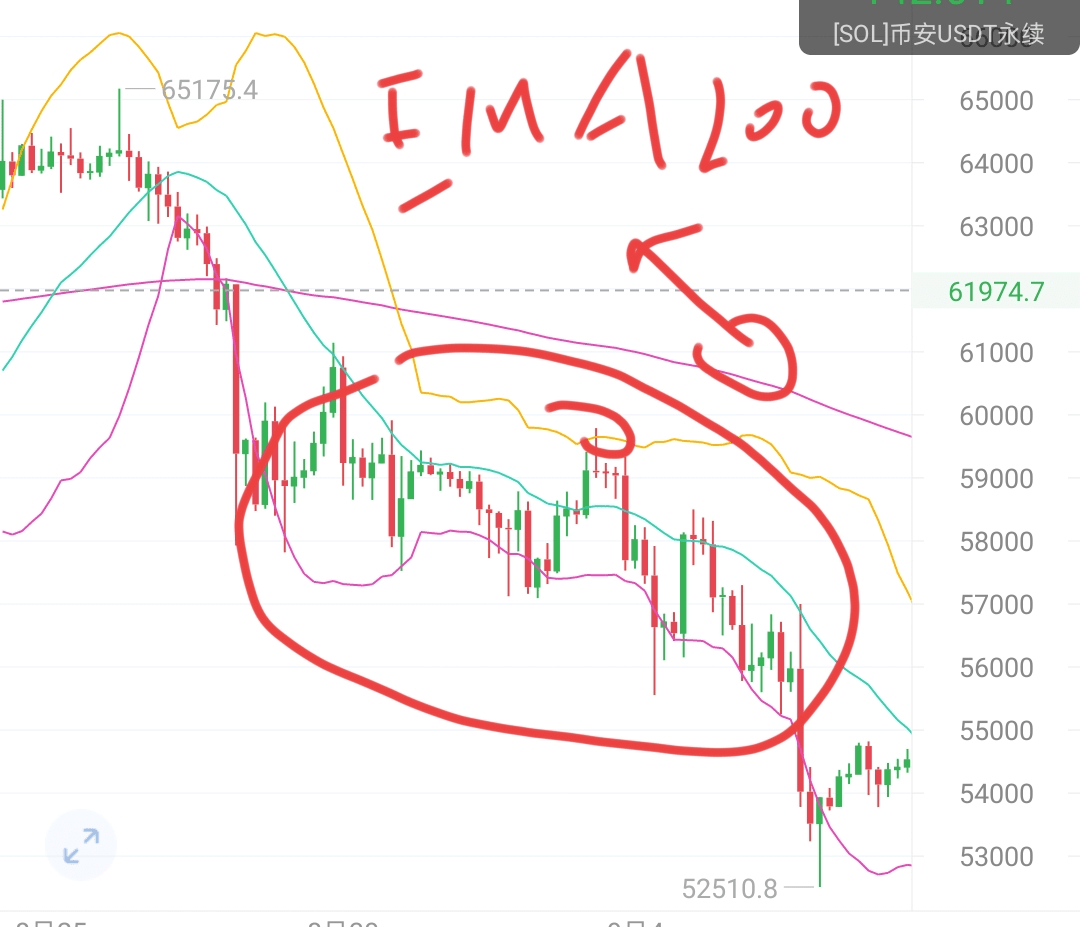
EMA200 day moving average has been marked. Please understand what it means that the overall price is above or below EMA200 day. The red circle is the overall price, the yellow line is the upper track, and the purple line is the lower track. Only short below EMA, only long above EMA. Pay attention to ensure the winning rate of this indicator strategy. Use it when the upper and lower tracks of the boll line tend to be parallel. The winning rate is extremely high. If the opening trend of the upper and lower tracks becomes larger, only the volume is not used.
Technical indicator three: Divergence of volume, see the chart
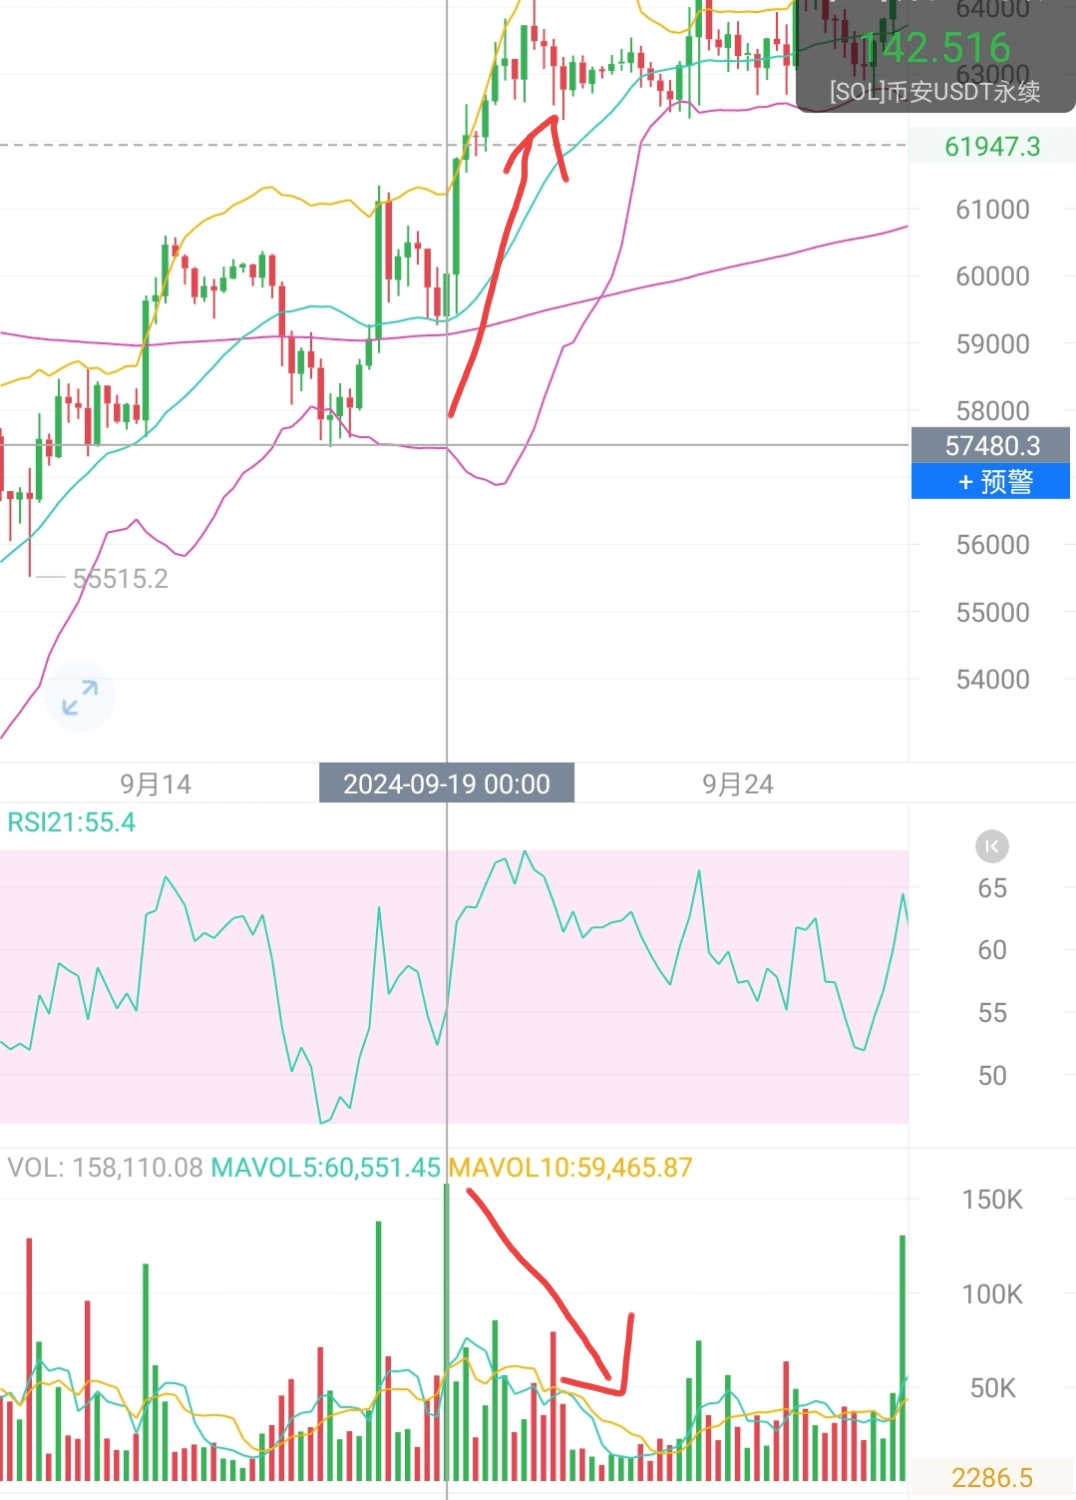
Volume-price divergence is used as an auxiliary to the previous two methods, or as an auxiliary to your use of naked K-line patterns to make bullish or bearish signals, and is not used alone as a strategy. The first type of volume-price divergence is a top divergence, which is shown in the figure. The price rises but the volume decreases, which means it is bearish.
On the other hand, a falling price and gradually rising volume are bullish bottom divergences.
Originally, there were some money-making strategies for MACD and naked K. Remember, I am talking about those that can make money, not the indicator strategies you see on the Internet. I have adjusted these parameters myself, and I have used these parameters for many years. Because I use the wave theory myself, there are people in the square who know it, but they don’t know it completely, and they are only half-baked. So I will write an article on the wave theory in the evening to make it easier for you to understand my future posts. Therefore, the sharing of MACD strategies and naked K strategies will be in the evening.
Back to the first cycle and level, what suggestions do you have for today's intraday operations after looking at today's daily closing? Think about it carefully.
Follow Shihun and share your views for free every day.

