
2024/9/12 Data Analysis Conclusion: Reef Trend 🐮#量化王
The article ends with specific entry and exit points. When they are reached, we will continue to serialize reefs. Welcome to follow and verify.

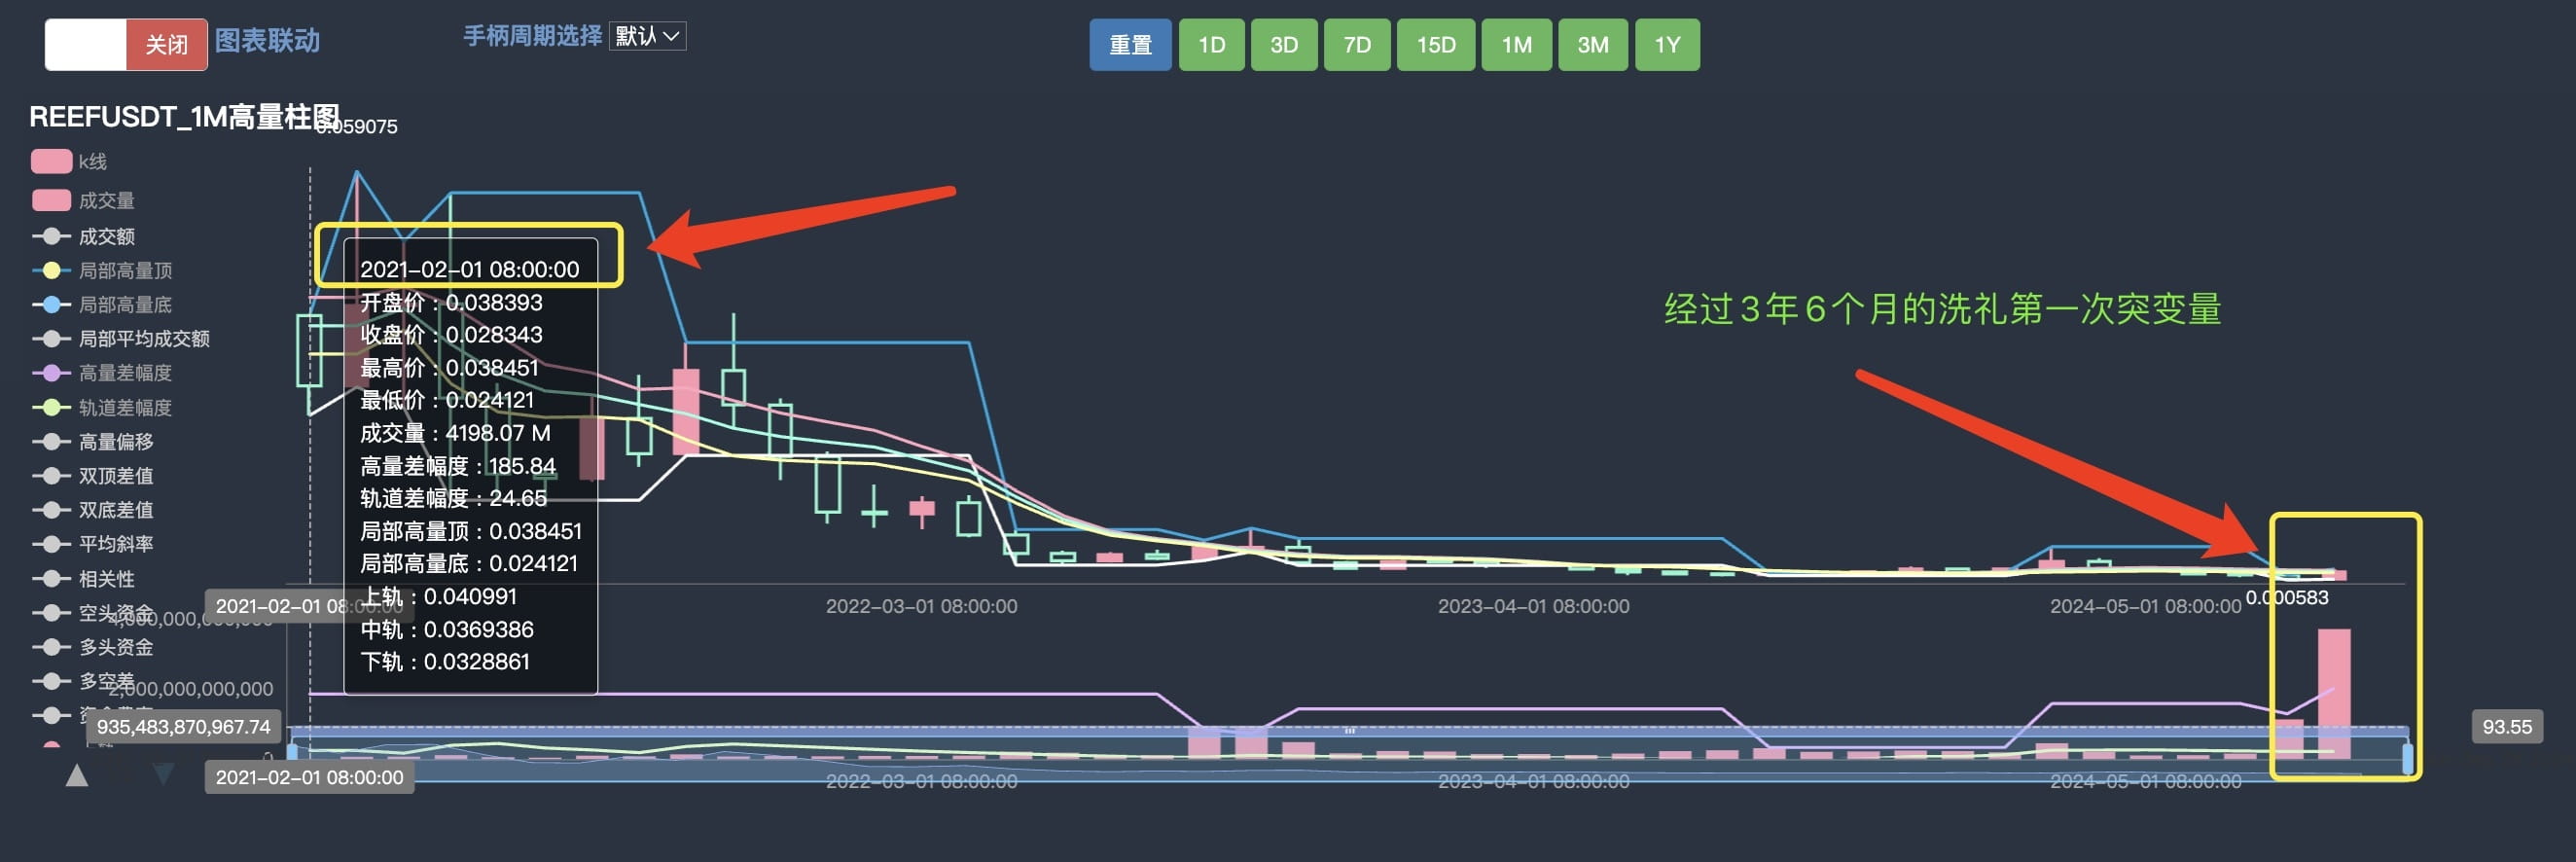 Figure 1
A 3.6-year breakthrough
(Figure 1) After opening the system prompt, I found that after 3.6 years of baptism, there was a dark horse in the past week: REEF. The funds entering the market tripled in value within 30 days, reaching 140 million US dollars. So I conducted a comprehensive data analysis.
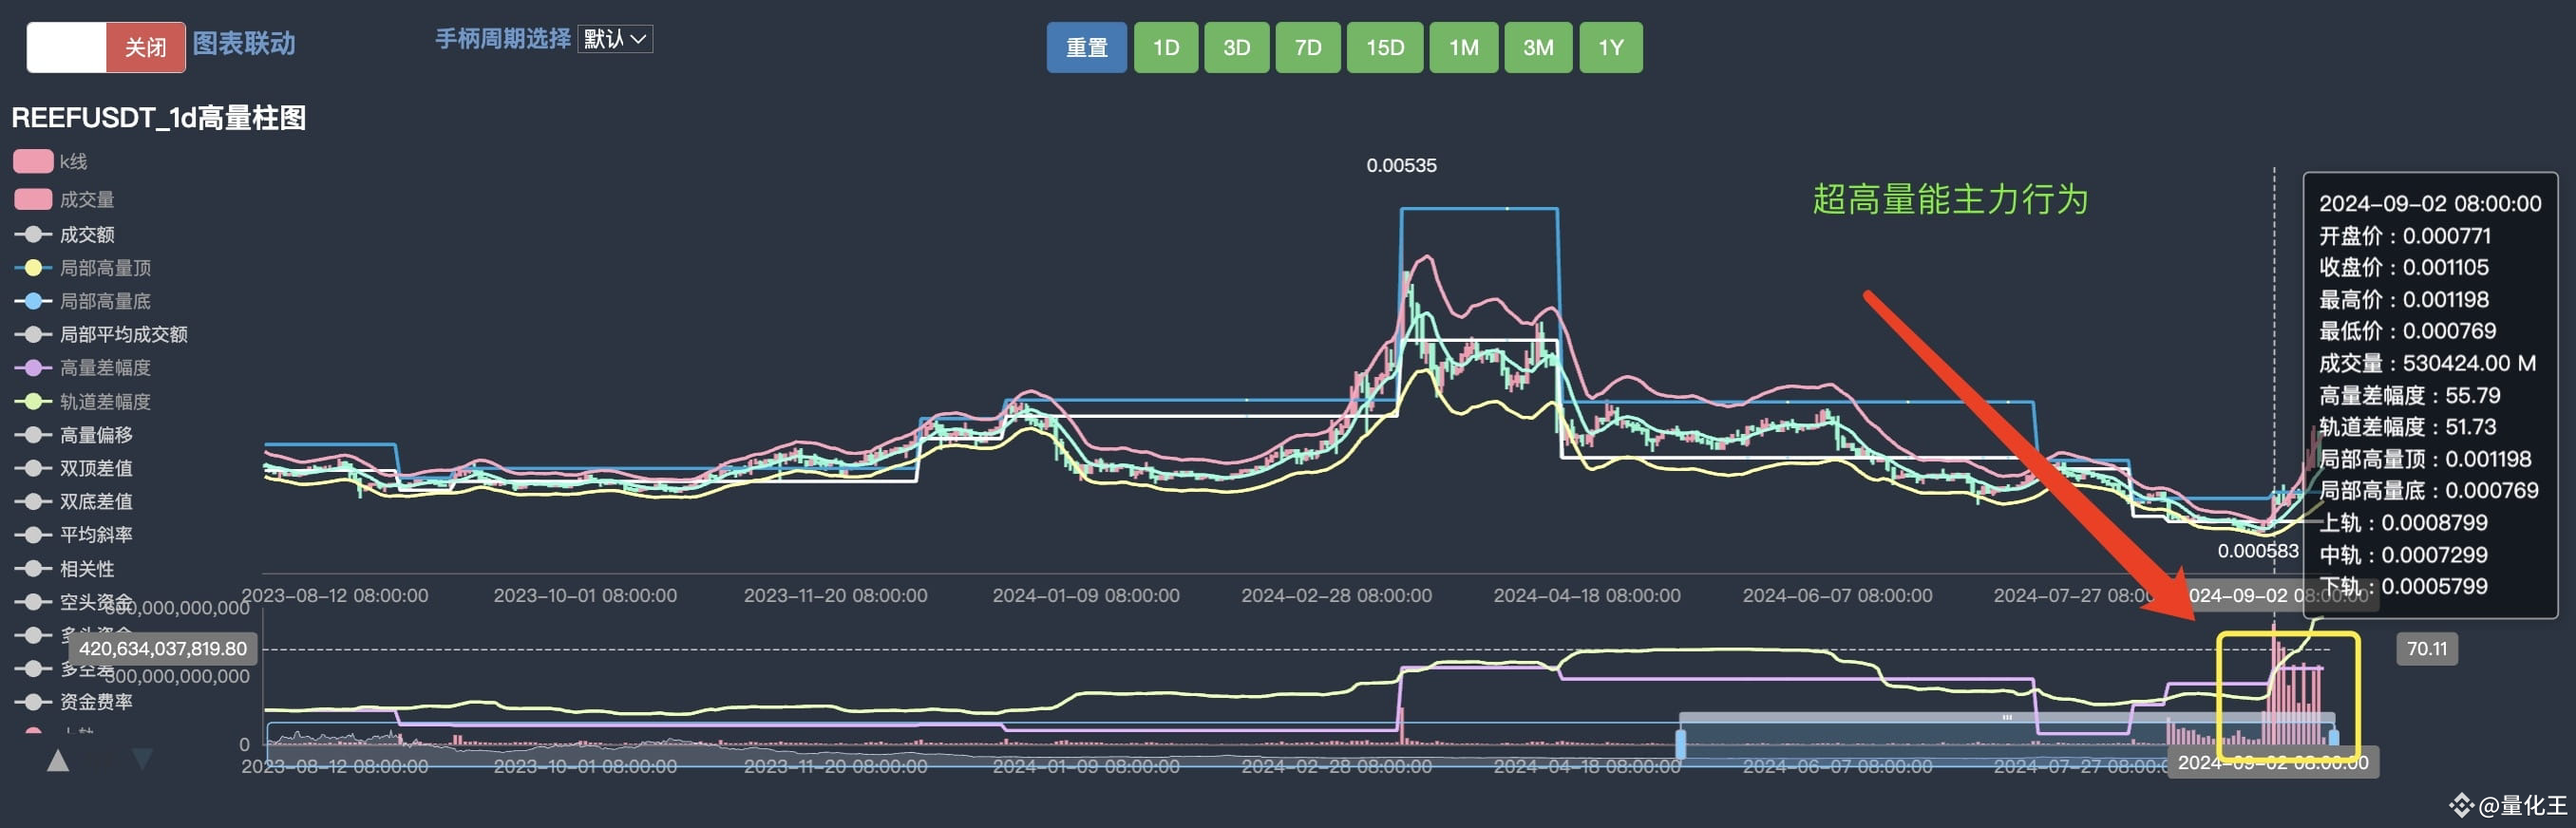 Figure 2
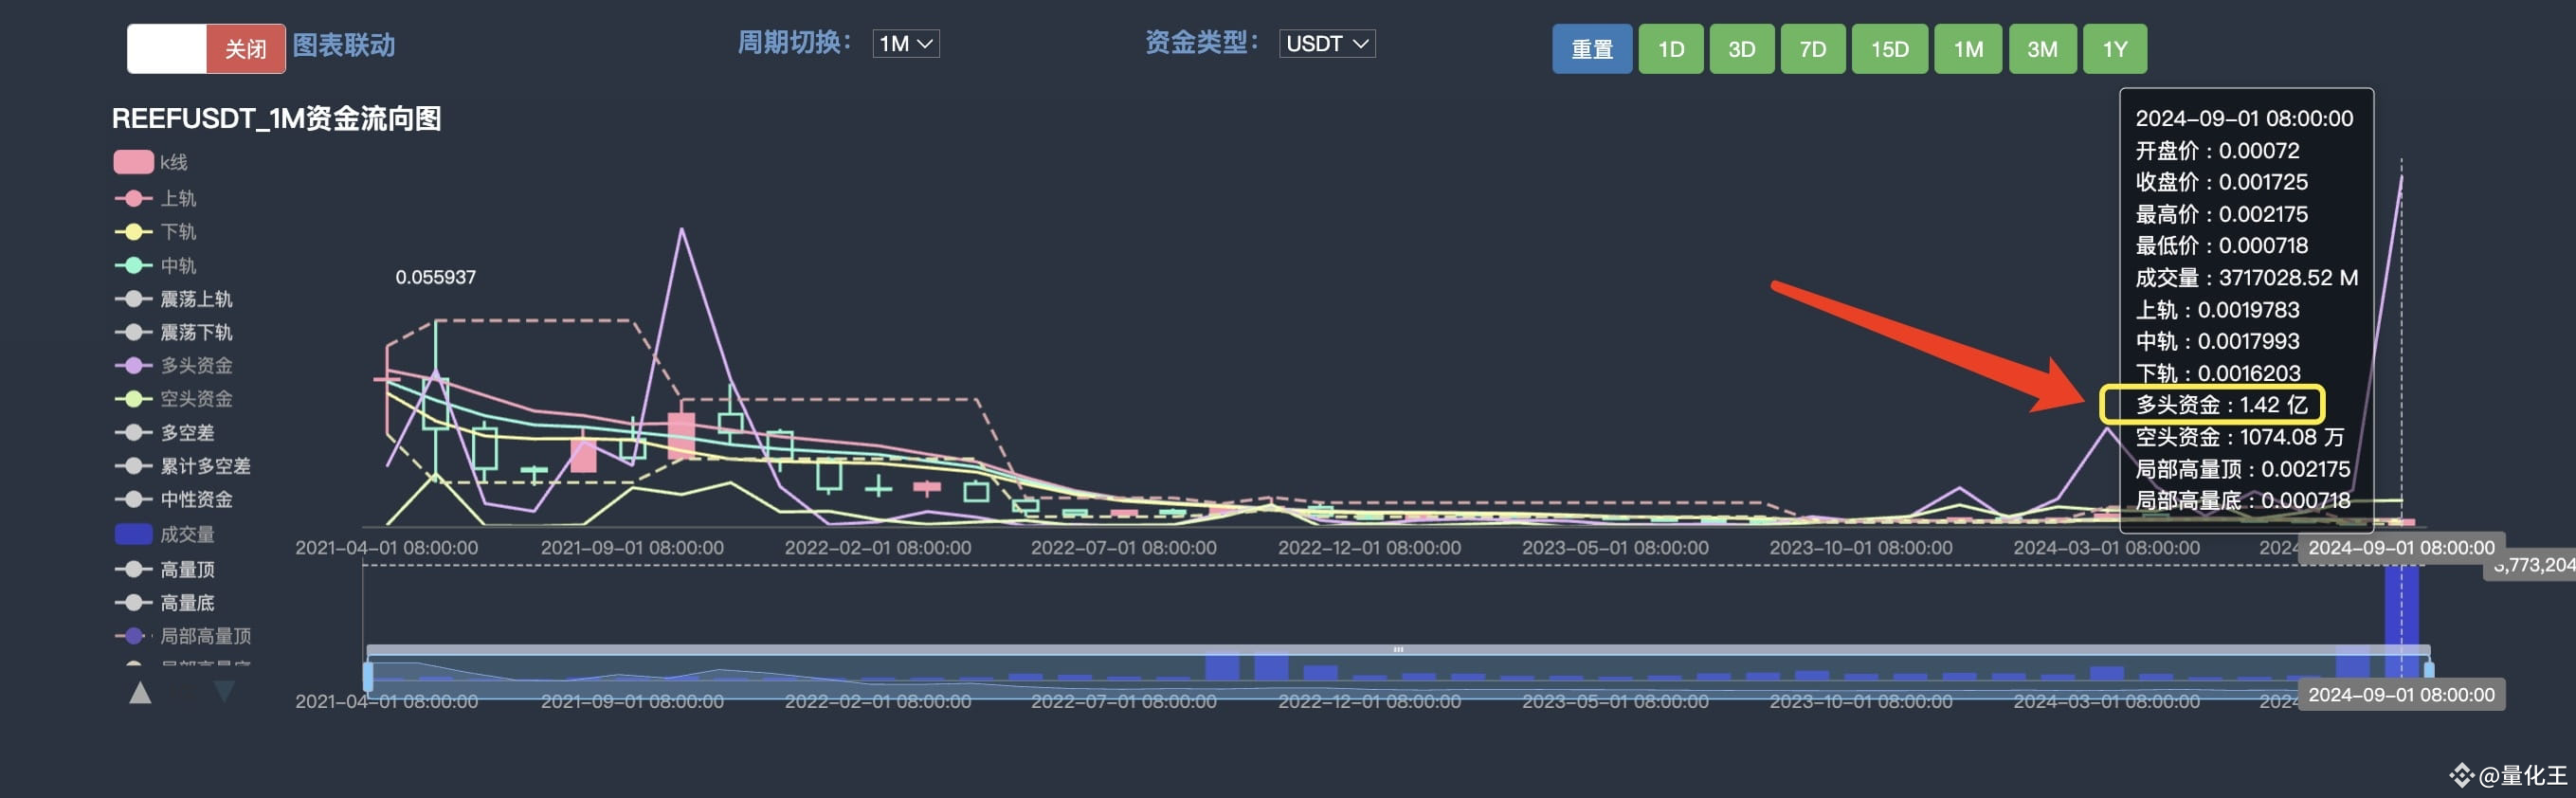 Figure 3
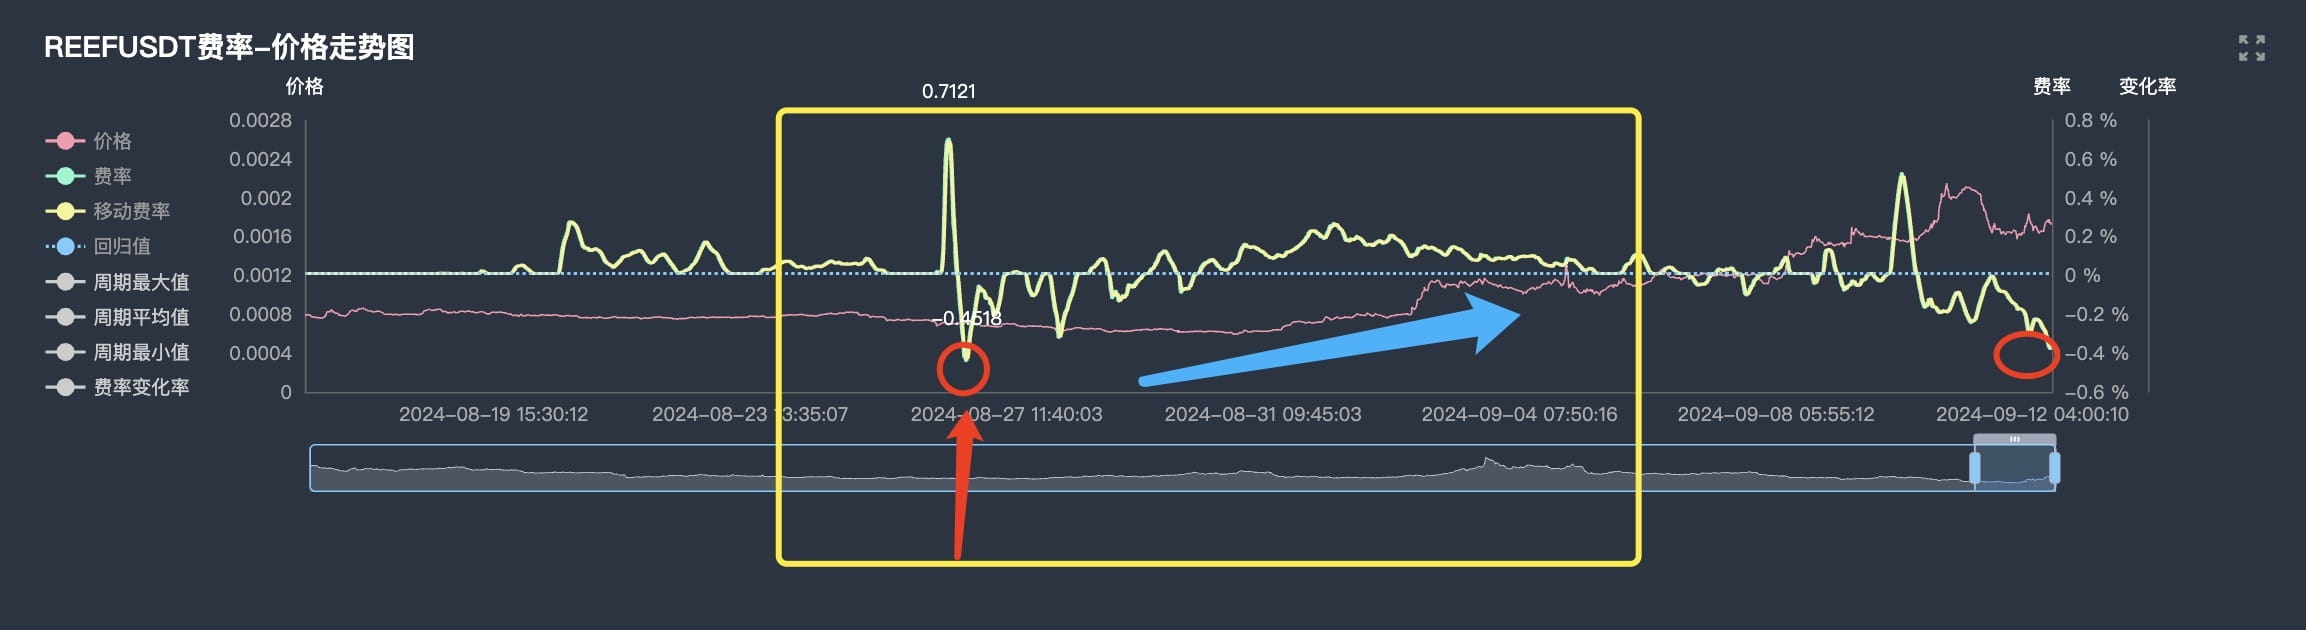 Figure 4
Figure 2: The main force has accumulated suddenly after a week of continuous increase
Figure 3: The main funds are increasing in volume
Figure 4: Funding rate shows that there is an opportunity to enter the market in the near future
Through the above data collection, the conditions for the rise of this coin are met, it is worth paying attention to and it is worth following the main players to enter the market. Then here comes the dry goods, specific data and operation methods:
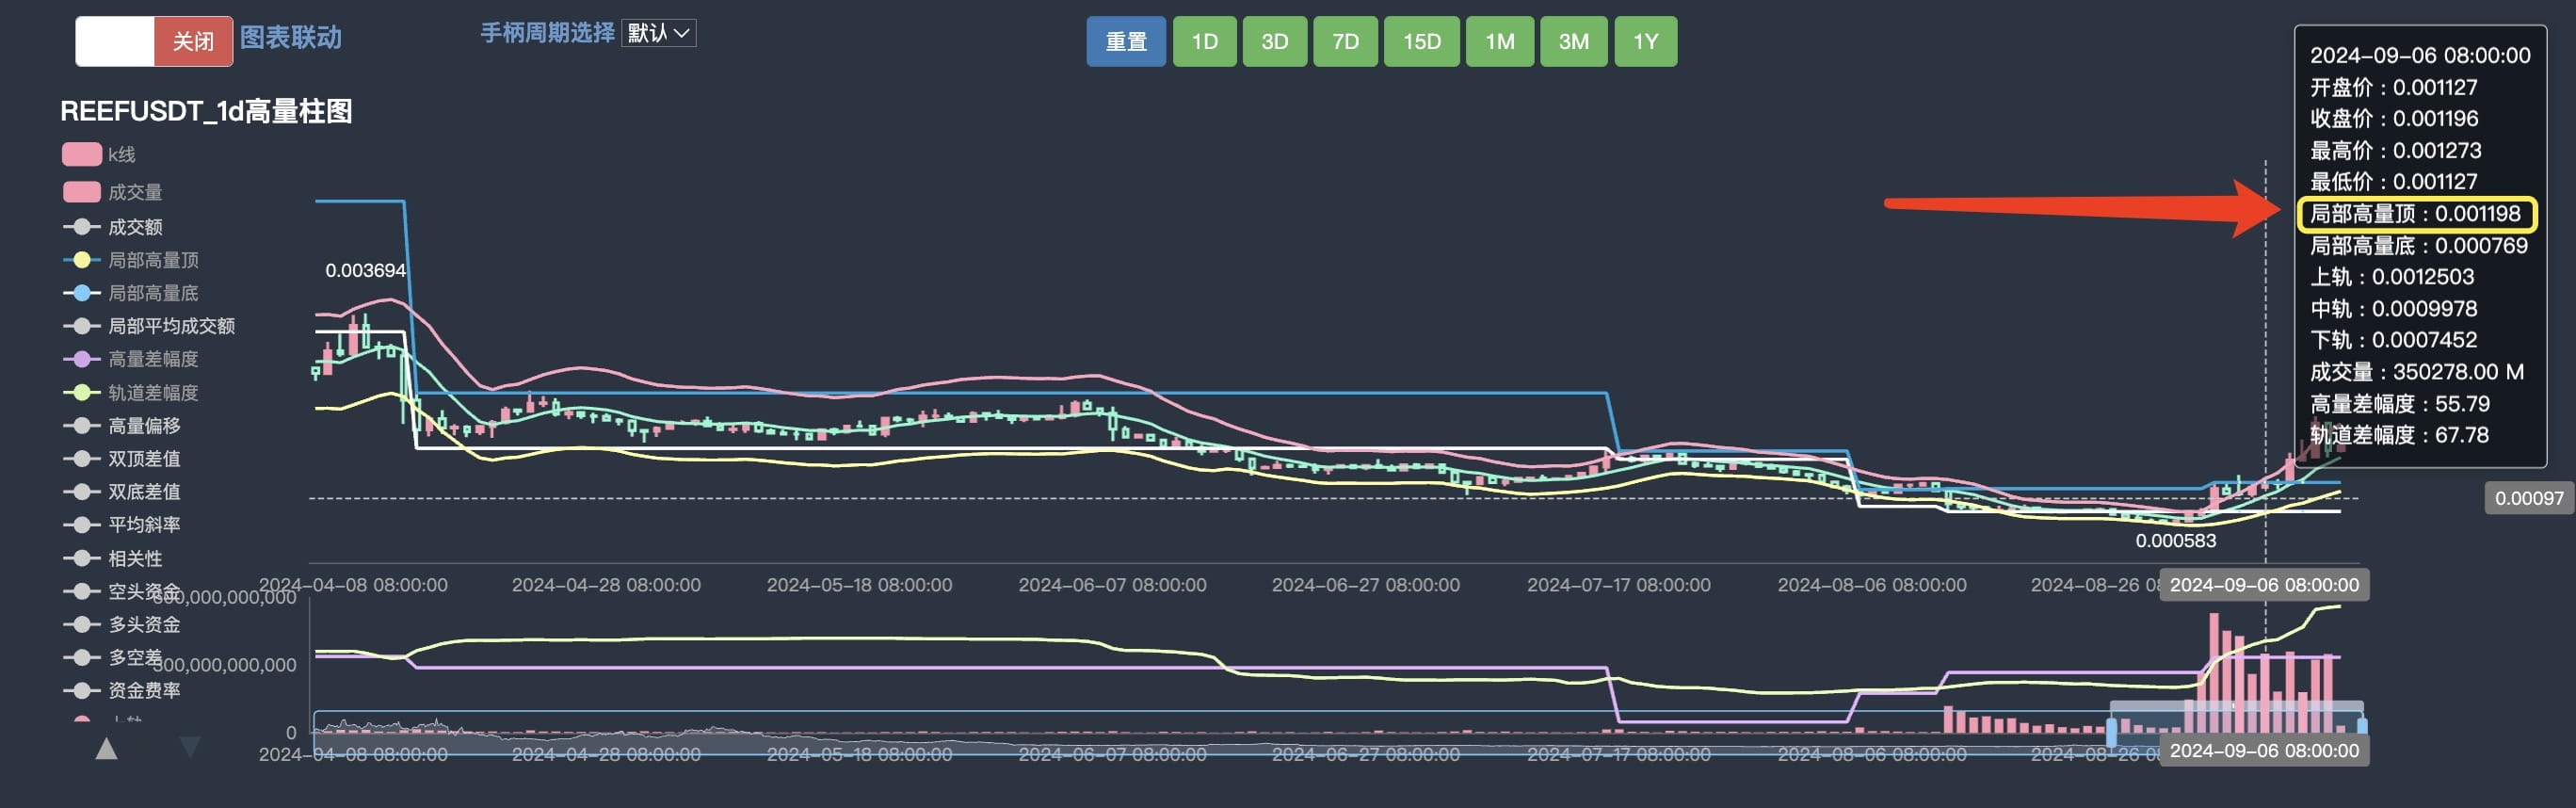
(Figure 5) Entry point
(Figure 5) The entry point selection is based on volume and price breakthrough. Now it is at a relatively high level, so wait for the callback to the main force's relative support point to gain the maximum profit and profit-loss ratio. Around 0.0012
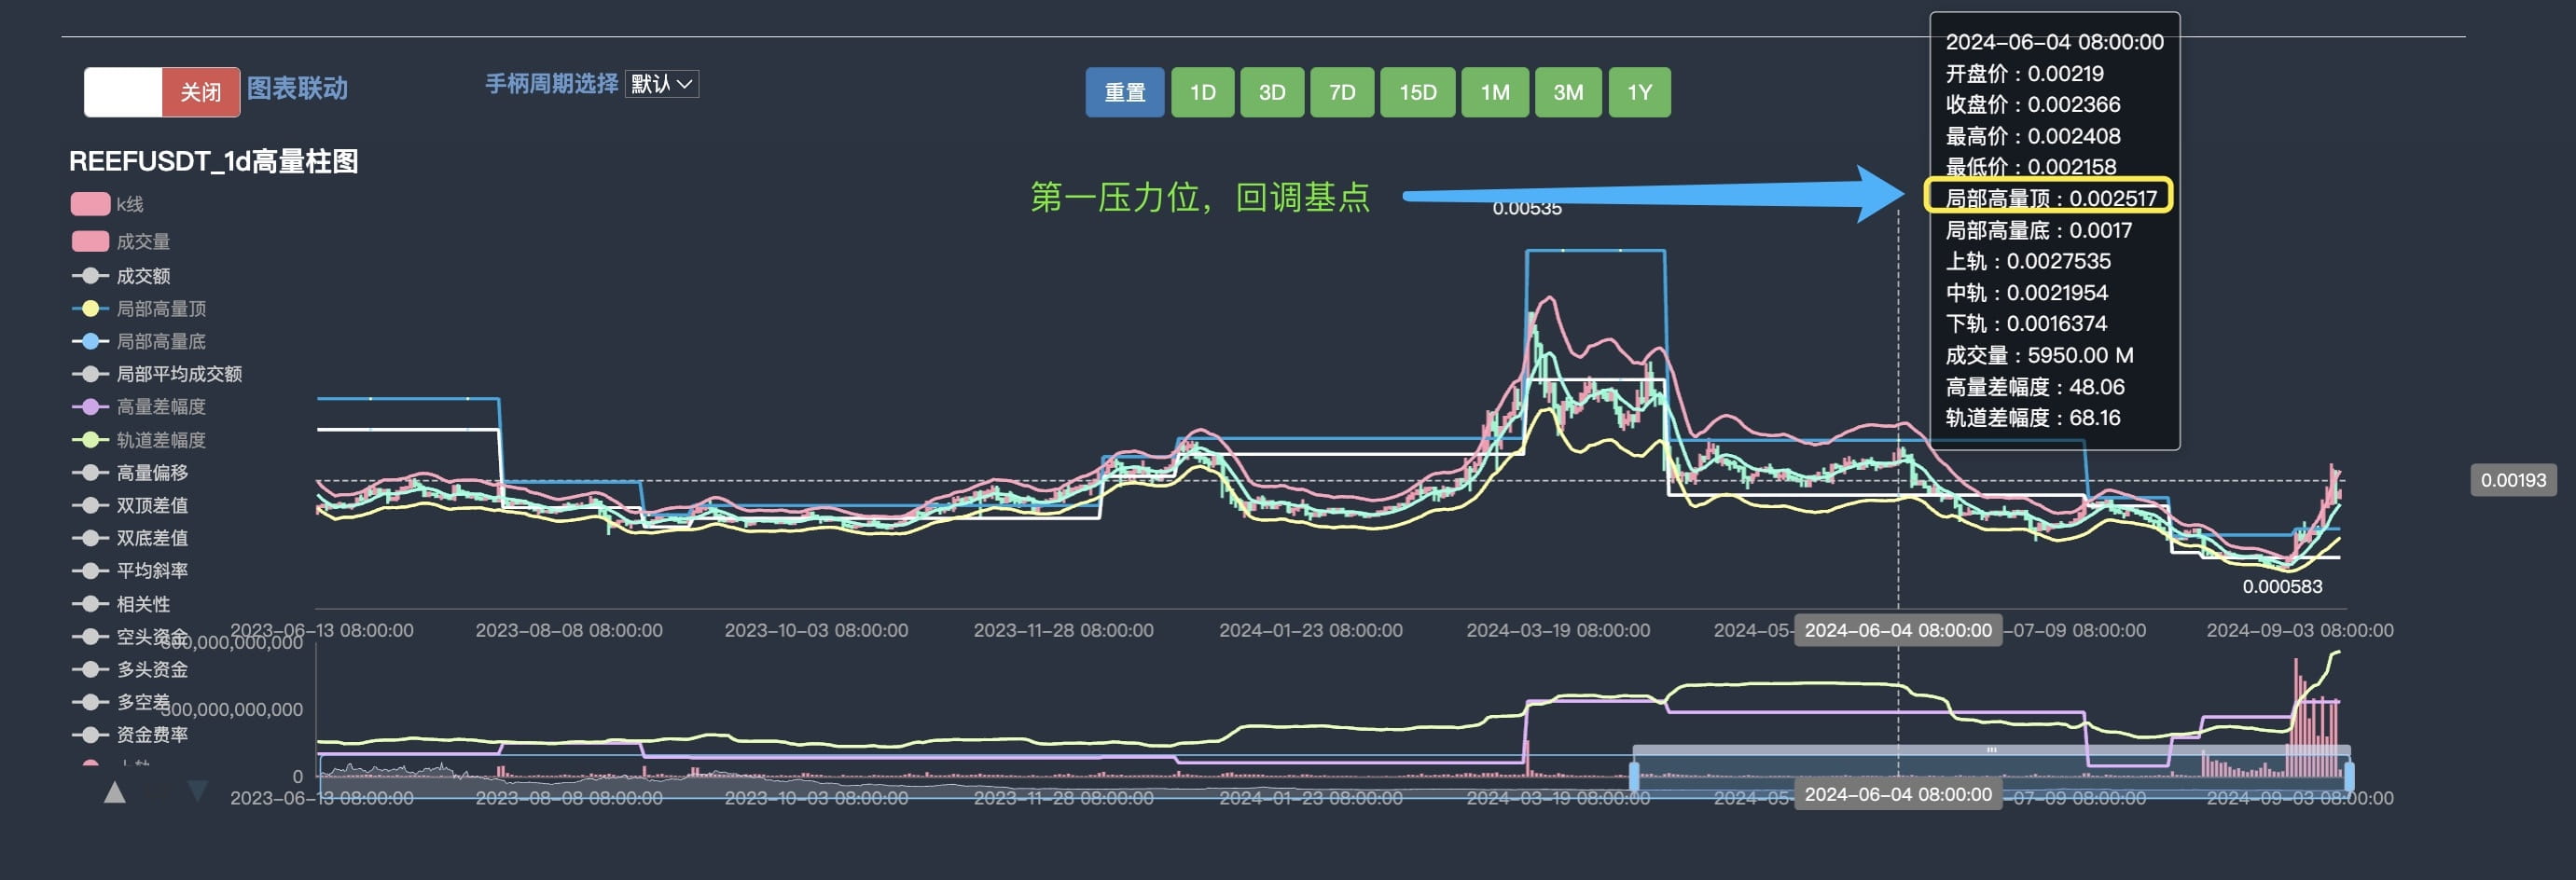
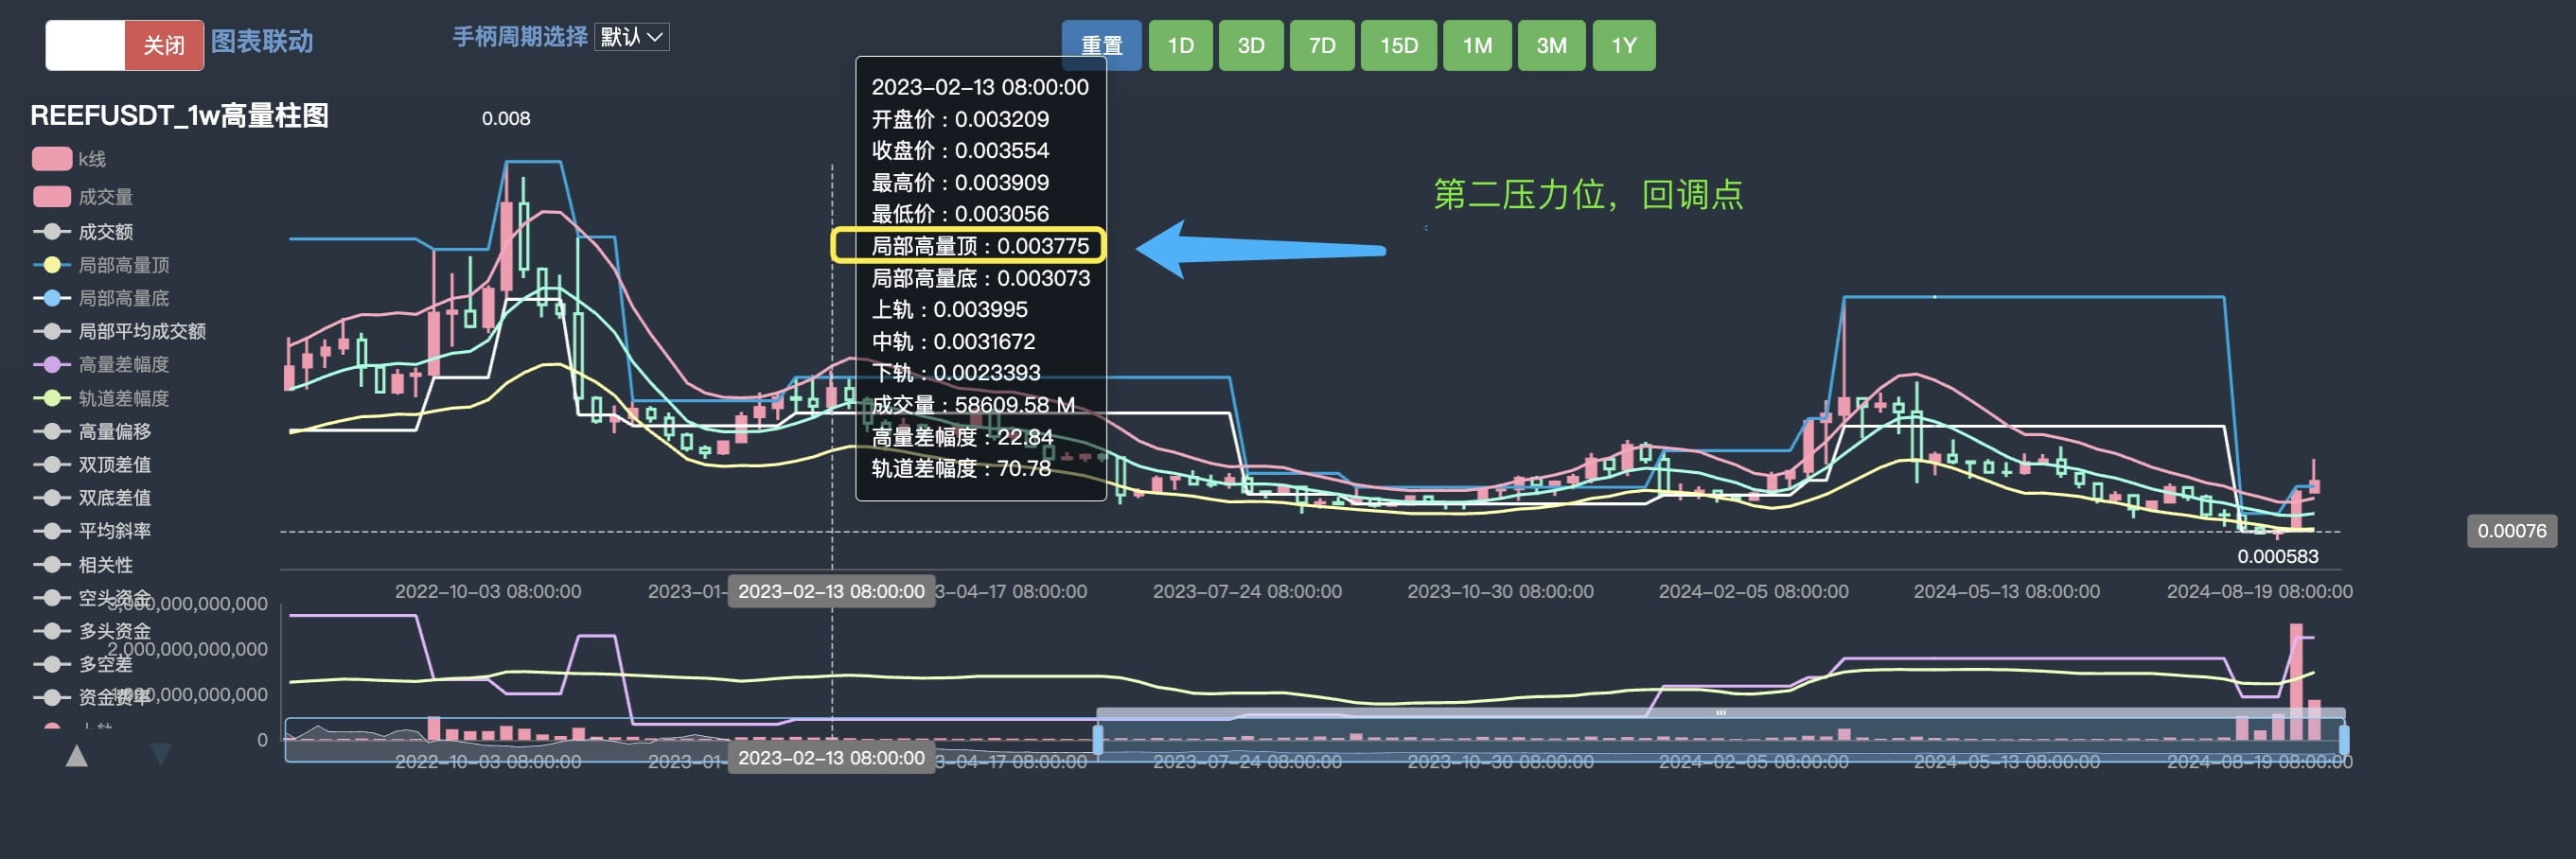
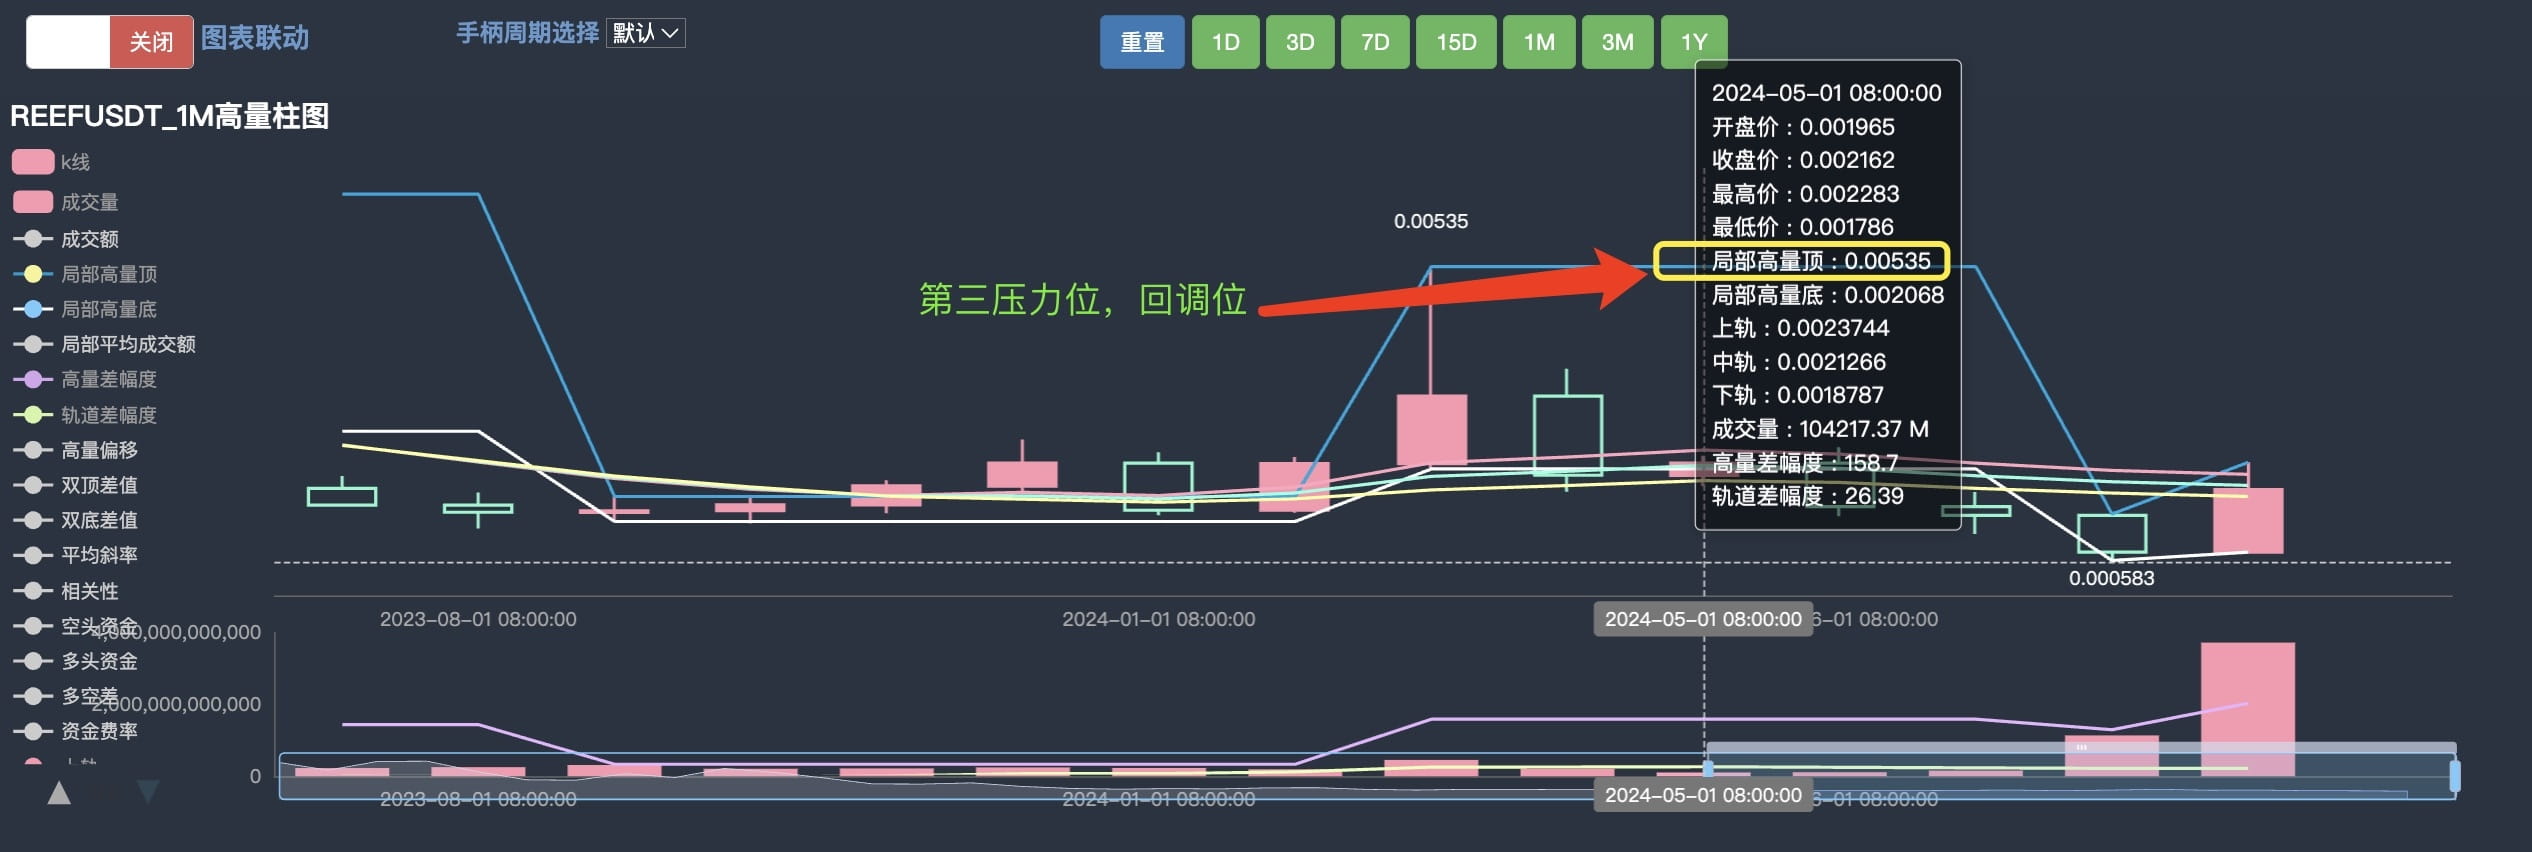
Figures 6, 7 and 8 give the three-stage exit positions based on the historical data of volume and price over the past 3.6 years.

(Figure 9) Conclusion drawn based on all the information.
The King of Quantification - only gives specific points and plans, never ambiguous or vague.
Welcome to follow and verify: Here, regardless of bull or bear market, the system can always give corresponding strategies according to market changes. 😀 (Everyone is welcome to make suggestions and corrections) All logic is only shared, not investment advice.