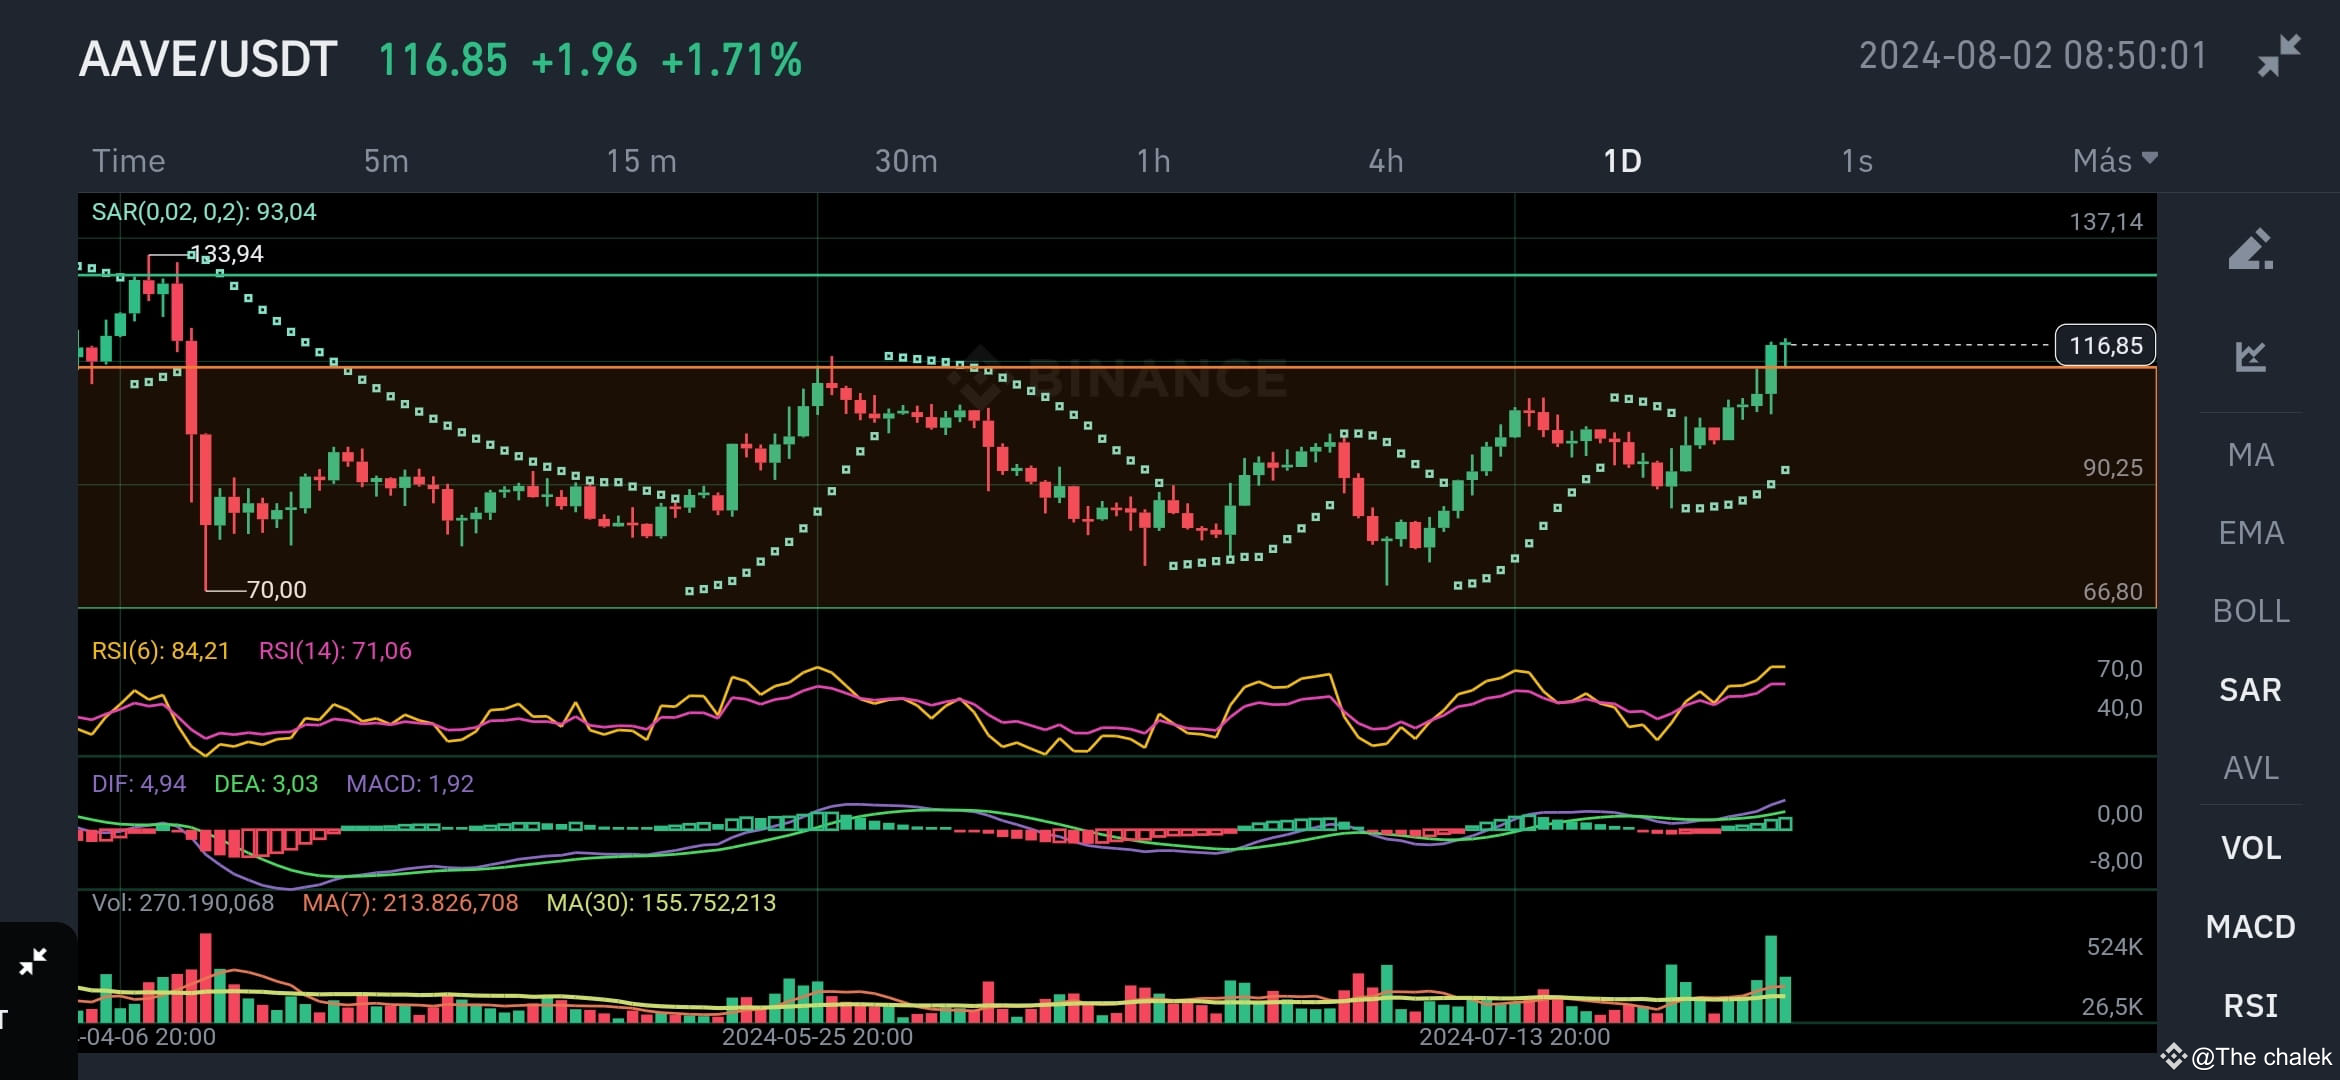
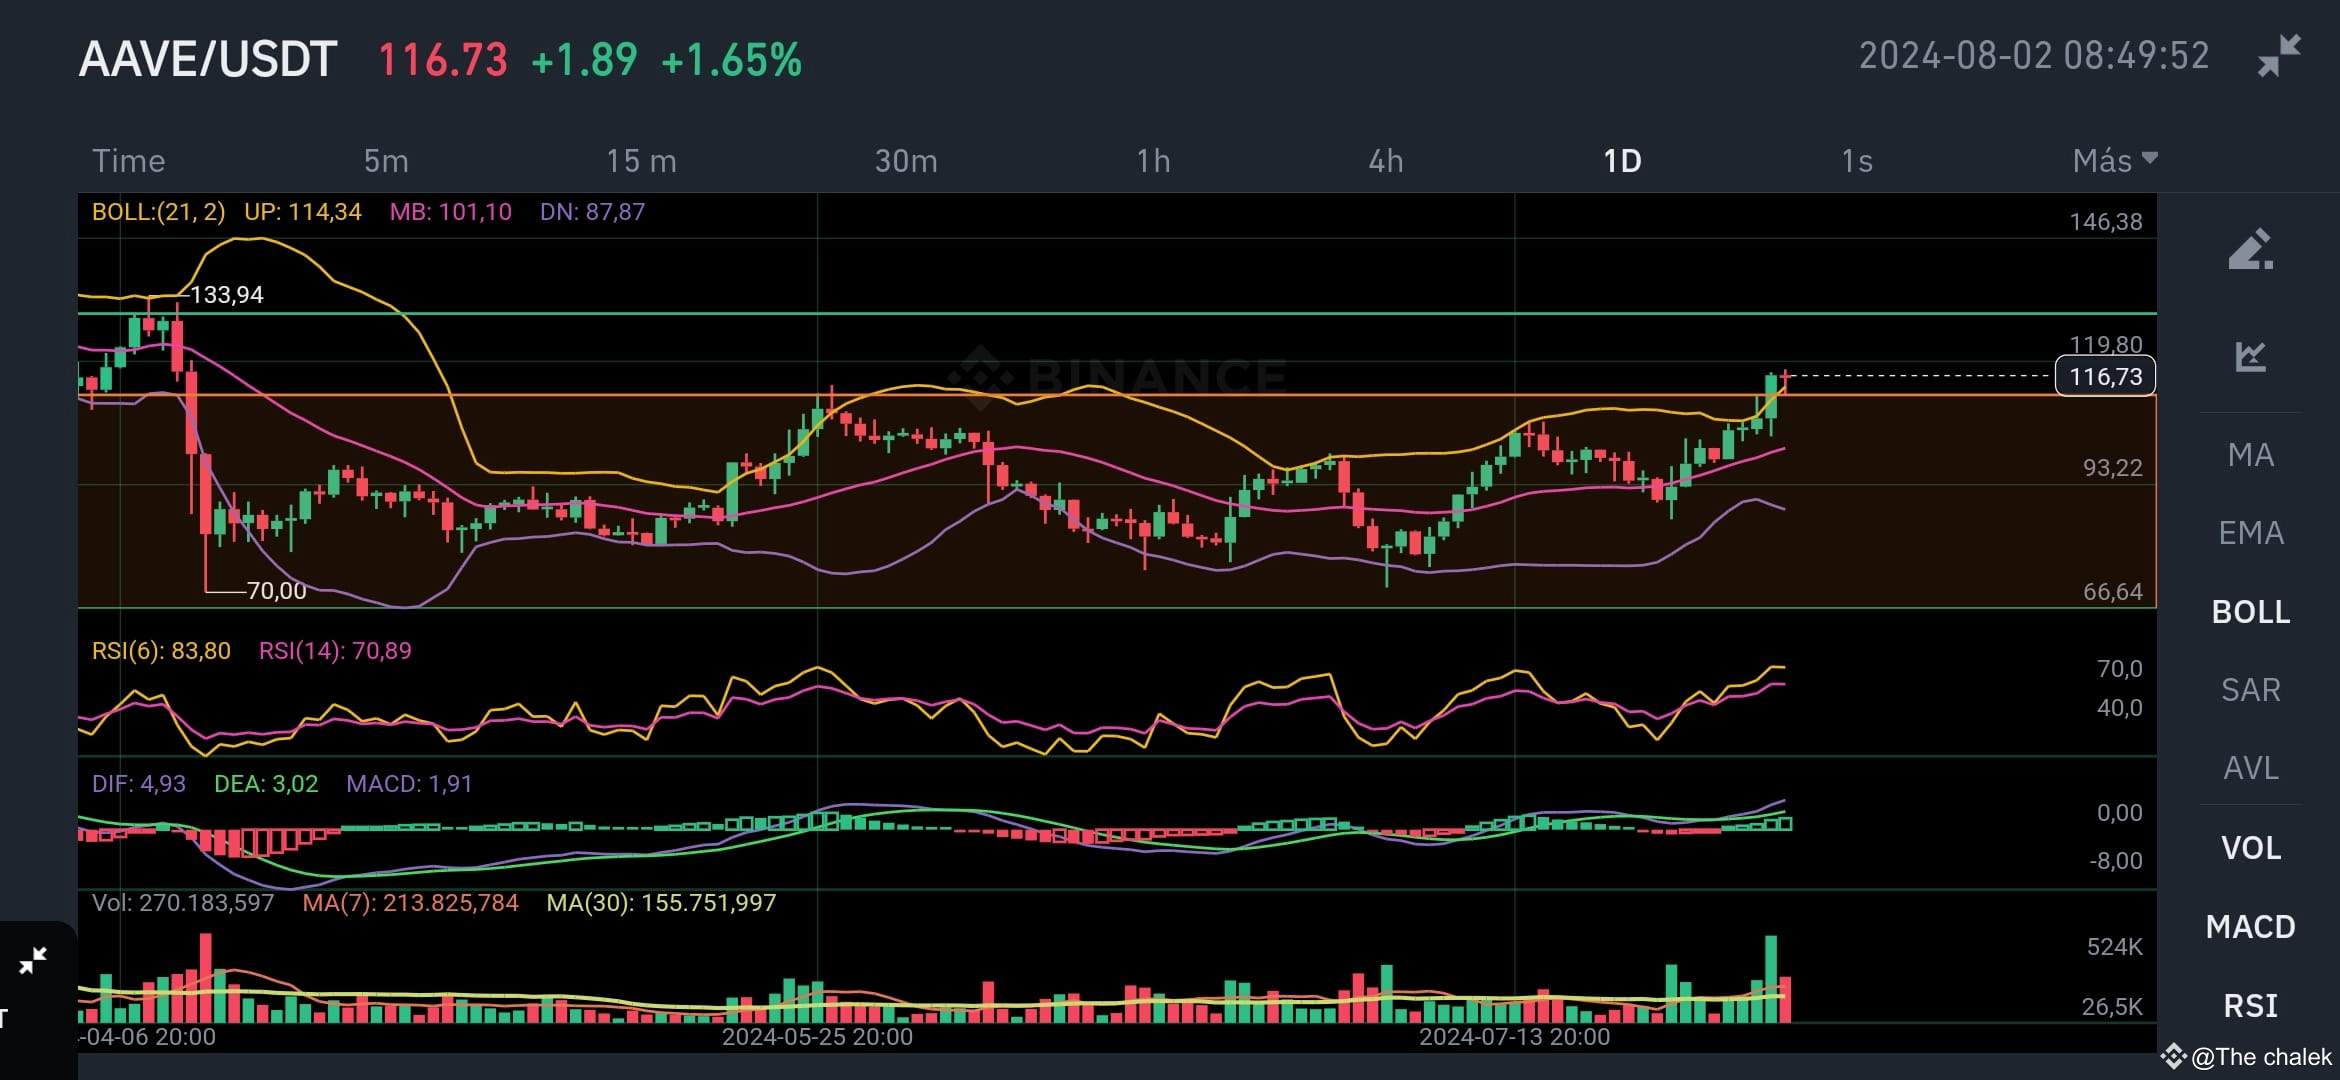
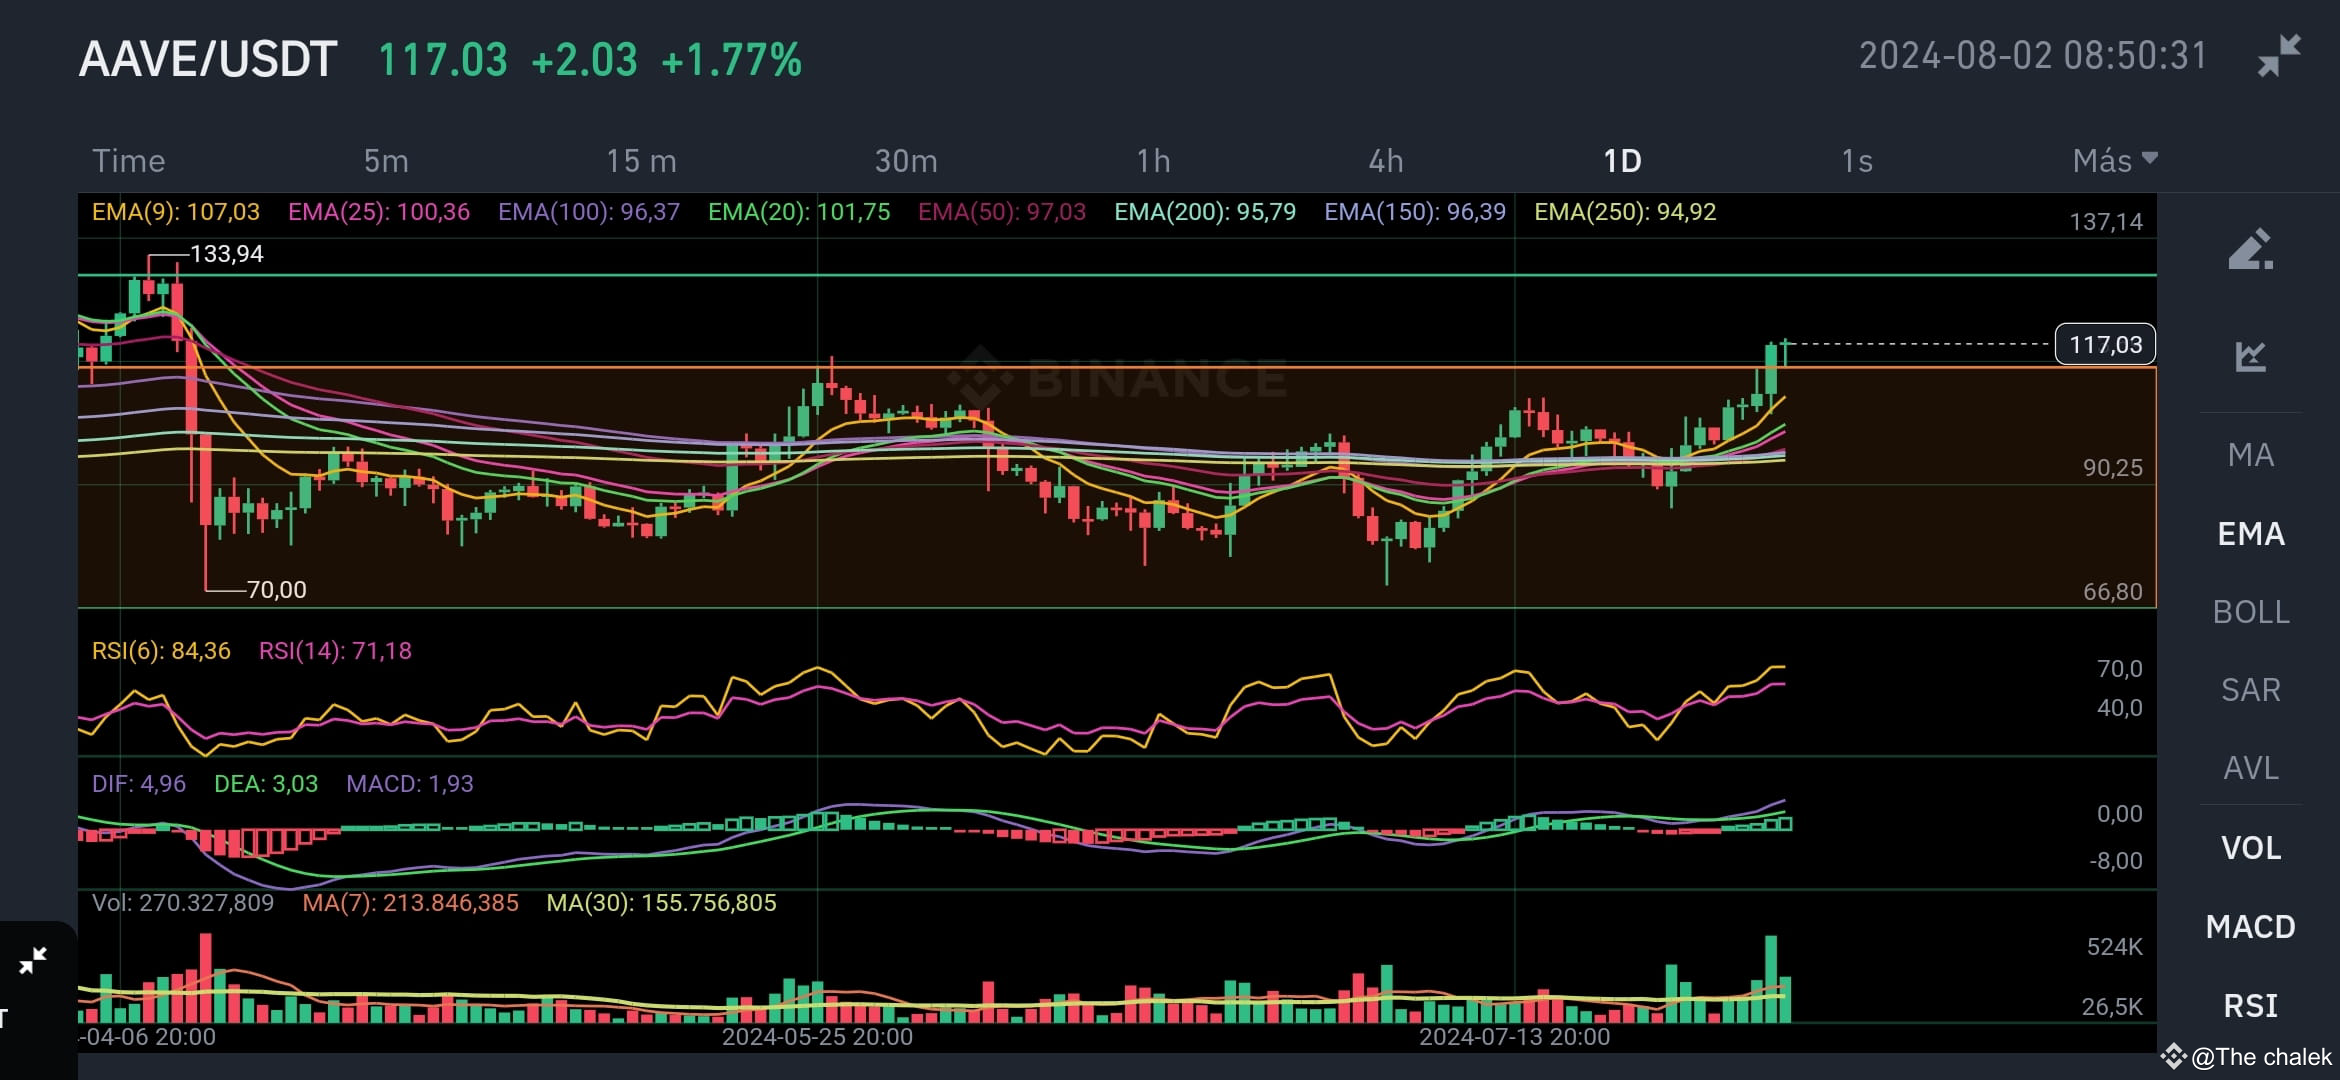
$BTC $ETH $AAVE #AAVE In the daily time frame, it can be seen how the price has been increasing to levels of $118, which, as I had already explained in previous publications, acts as resistance. If the price manages to break that resistance, it could go towards the next resistance that is located in the area. $130-$133. You can also see that the price has been oscillating between $70 and $118 therefore pay attention to a break above the resistance of $118 which can be an important point for a long entry otherwise if you want to trade short Consider opening a trade after this resistance is strongly rejected. In the daily framework at the moment the indicators say the following:
Moving Average (MA)
MA 09 and 20: indicate that the price after a neutral trend has begun to rise and show signs of an upward movement in the short term. so watch for a break at $118
MA 50-100 and 200: the medium and long-term averages are relatively flat, so the price still does not indicate a clear direction in the medium and short term. If it does not exceed $118, it is likely that the price will oscillate within these averages for a while.
RSI: currently in the overbought zone indicates that a consolidation or correction is possible.
MACD: is currently in the positive zone and the MACD line is slightly above the signal line, so the indicator expresses a slight bullish momentum.
SAR: the indicator expresses a slight bullish momentum.
Bolinger bands: the bands have begun to expand so it is likely that the volatility of the pair will increase both upwards and downwards so pay attention 👀.
In conclusion, at the moment AAVE seems bullish but in reality based on the indicators it still remains neutral. It is also worth noting that #Bitcoin is currently bearish so it is most likely that the price of AAVE will continue to oscillate in the range of $70-$118 for longer.
Key Supports to Consider for Long Trades:
97-100$
$85
70-75$
Moving Average (MA)
MA 09 and 20: indicate that the price after a neutral trend has begun to rise and show signs of an upward movement in the short term. so watch for a break at $118
MA 50-100 and 200: the medium and long-term averages are relatively flat, so the price still does not indicate a clear direction in the medium and short term. If it does not exceed $118, it is likely that the price will oscillate within these averages for a while.
RSI: currently in the overbought zone indicates that a consolidation or correction is possible.
MACD: is currently in the positive zone and the MACD line is slightly above the signal line, so the indicator expresses a slight bullish momentum.
SAR: the indicator expresses a slight bullish momentum.
Bolinger bands: the bands have begun to expand so it is likely that the volatility of the pair will increase both upwards and downwards so pay attention 👀.
In conclusion, at the moment AAVE seems bullish but in reality based on the indicators it still remains neutral. It is also worth noting that #Bitcoin is currently bearish so it is most likely that the price of AAVE will continue to oscillate in the range of $70-$118 for longer.
Key Supports to Consider for Long Trades:
97-100$
$85
70-75$