🔥🔥🚀$RNDR análise de preços com base nos dados atuais do mercado. 🚀
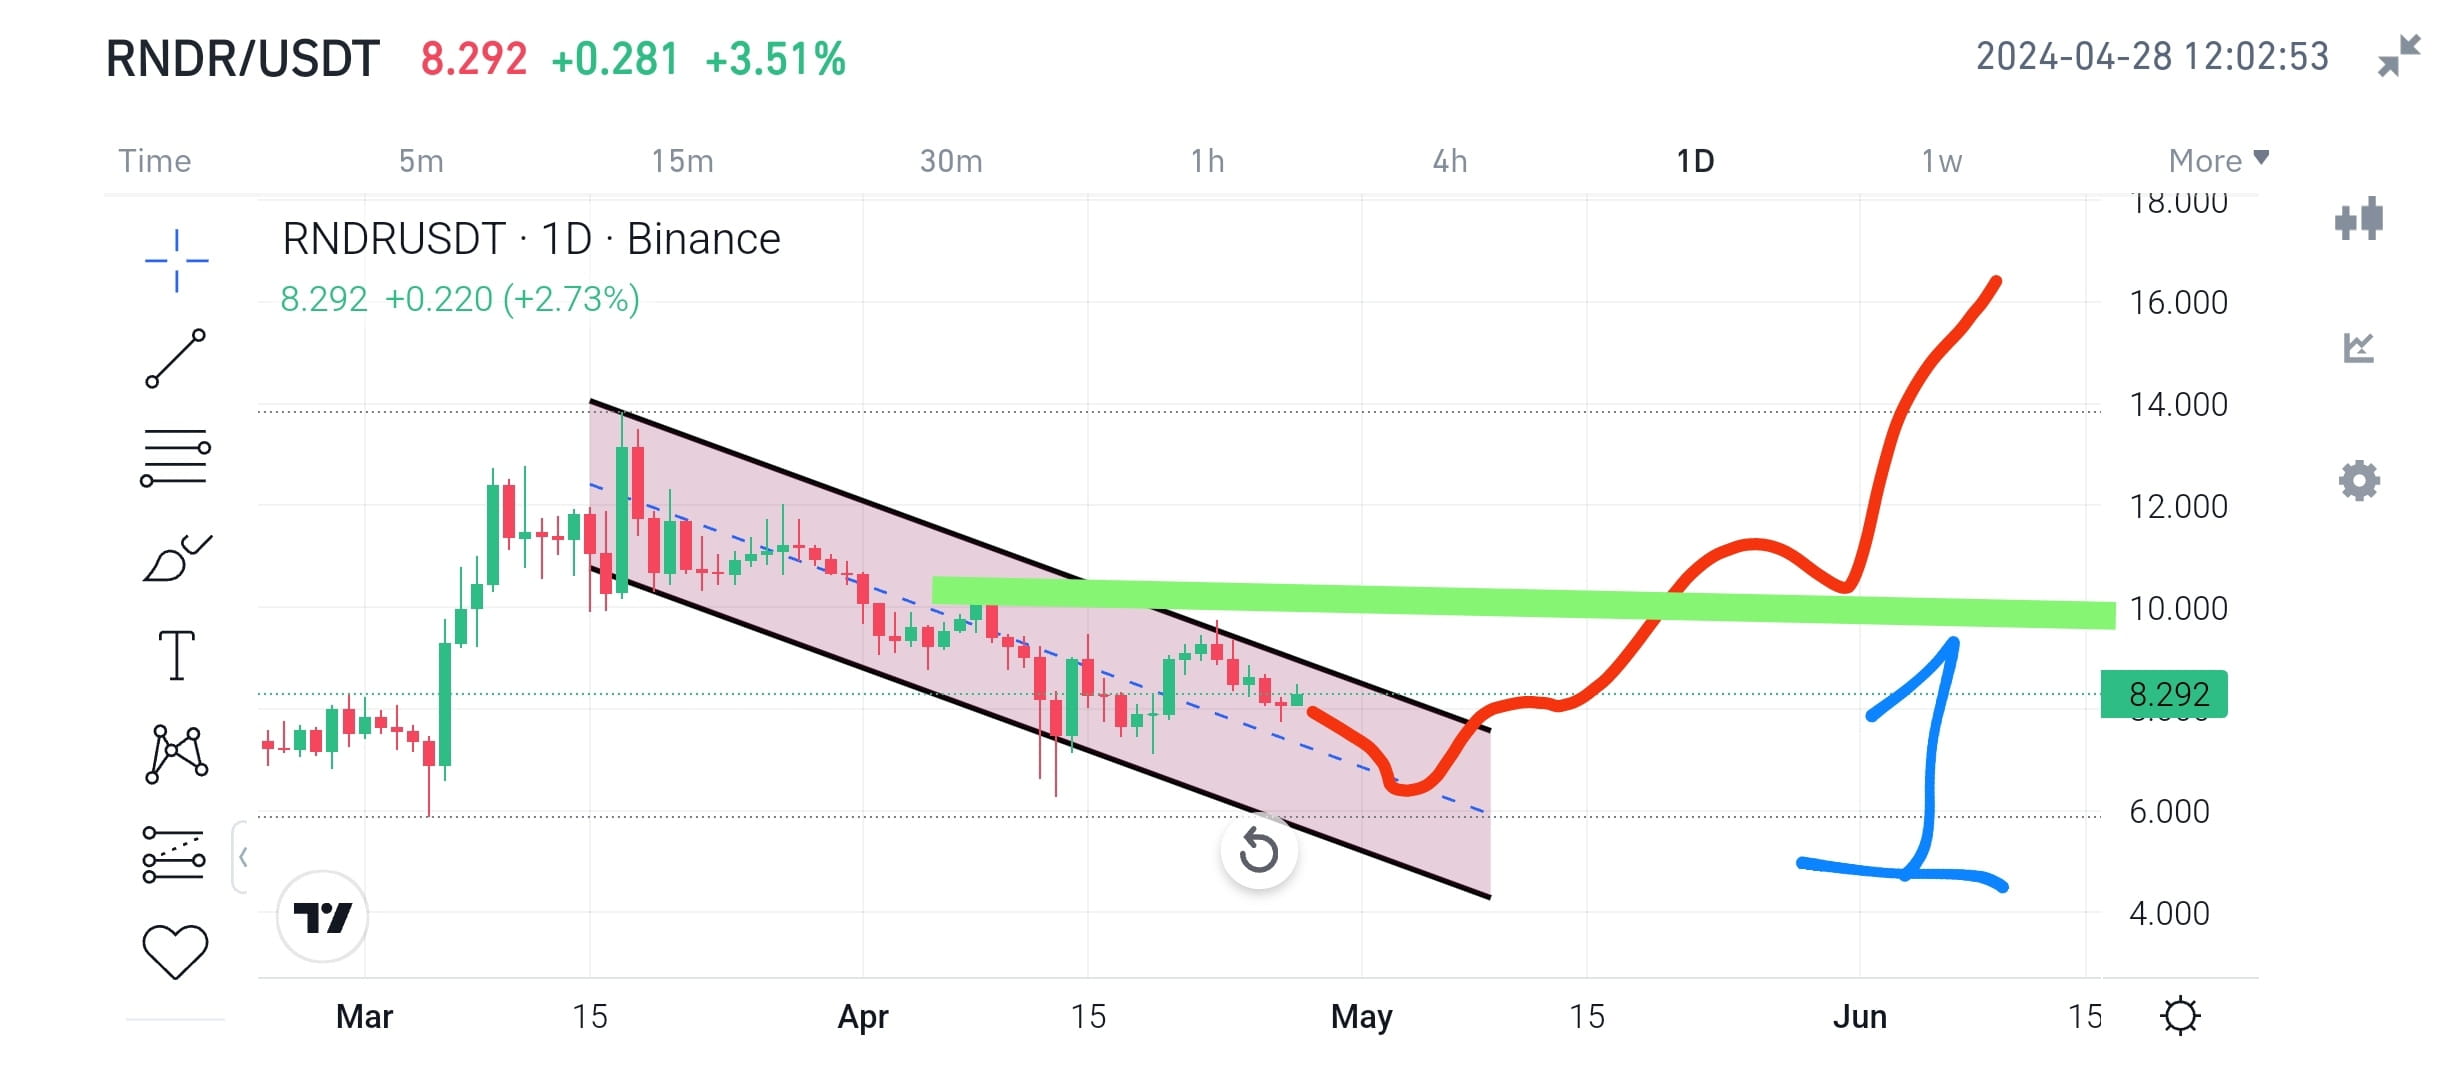
✅🔥 A Figura 1 mostra que #RNDR/USDT💥 está se consolidando entre a parte central e superior do canal, ou seja, uma atuando como suporte (linha de tendência central) e outra como resistência (linha de tendência superior) do canal descendente. Pode ser possível que ele teste novamente a zona de suporte mais algumas vezes, a partir de onde é altamente provável que os preços possam saltar e após o que o preço possivelmente continuará a subir com uma faixa de US$ 15-16. A RNDR está mostrando um bom movimento e já está 50-70% acima do recente despejo.
✅🔥 O gráfico da Figura 2 mostra que se o Render não conseguir quebrar a resistência do canal descendente, então o preço pode cair fortemente e provavelmente tocar o fundo do canal, mas é possível que $RNDR se recupere do suporte inferior do canal. A recuperação do suporte será forte como o último movimento e continuará a se mover para cima e possivelmente poderá quebrar a resistência superior do canal descendente. Este é um caso bastante forte para o movimento ascendente e a direção futura dos preços.
✅🔥 Compradores spot, se compraram por um preço mais alto, esperem que $RNDR contorne a zona inferior do canal descendente e então possam fazer DCA e HODL para obter uma boa recompensa. Uma observação do desempenho dos preços, das atividades recentes e do valor de mercado justifica a possibilidade de um aumento de 5 a 7 vezes durante a próxima etapa do mercado em alta. Portanto fique calmo e entenda a situação recente do mercado. As moedas AI são as líderes da corrida de touros nesta temporada.
📝POR FAVOR PRESSIONE SEGUIR se você gosta e concorda com a ideia e deseja mais informações sobre outras criptomoedas. DYOR para atividades financeiras. Esta informação é apenas para fins de aprendizagem e educação. Obrigado.