
鬼族研习社
329 Posts

鬼族研习社
公众号:鬼族研习社BTC 2020年老社区、专注链上数据分析、技术走势分析、信息面分析、基本面分析、直播等!聊天室里有BTC跟单体验!

Level 1 Creator
8.4 Years
15 Following
5.4K+ Followers
10.5K+ Liked
1 Badges
Posts
All
Videos
Live
PINNED
‼️Live stream every day at 3 PM (paused on holidays)
——————————
‼️Experience BTC copy trading in the chatroom
——————————
🌹Official account: Ghost Tribe Research Society BTC
——————————
‼️Experience BTC copy trading in the chatroom
——————————
🌹Official account: Ghost Tribe Research Society BTC
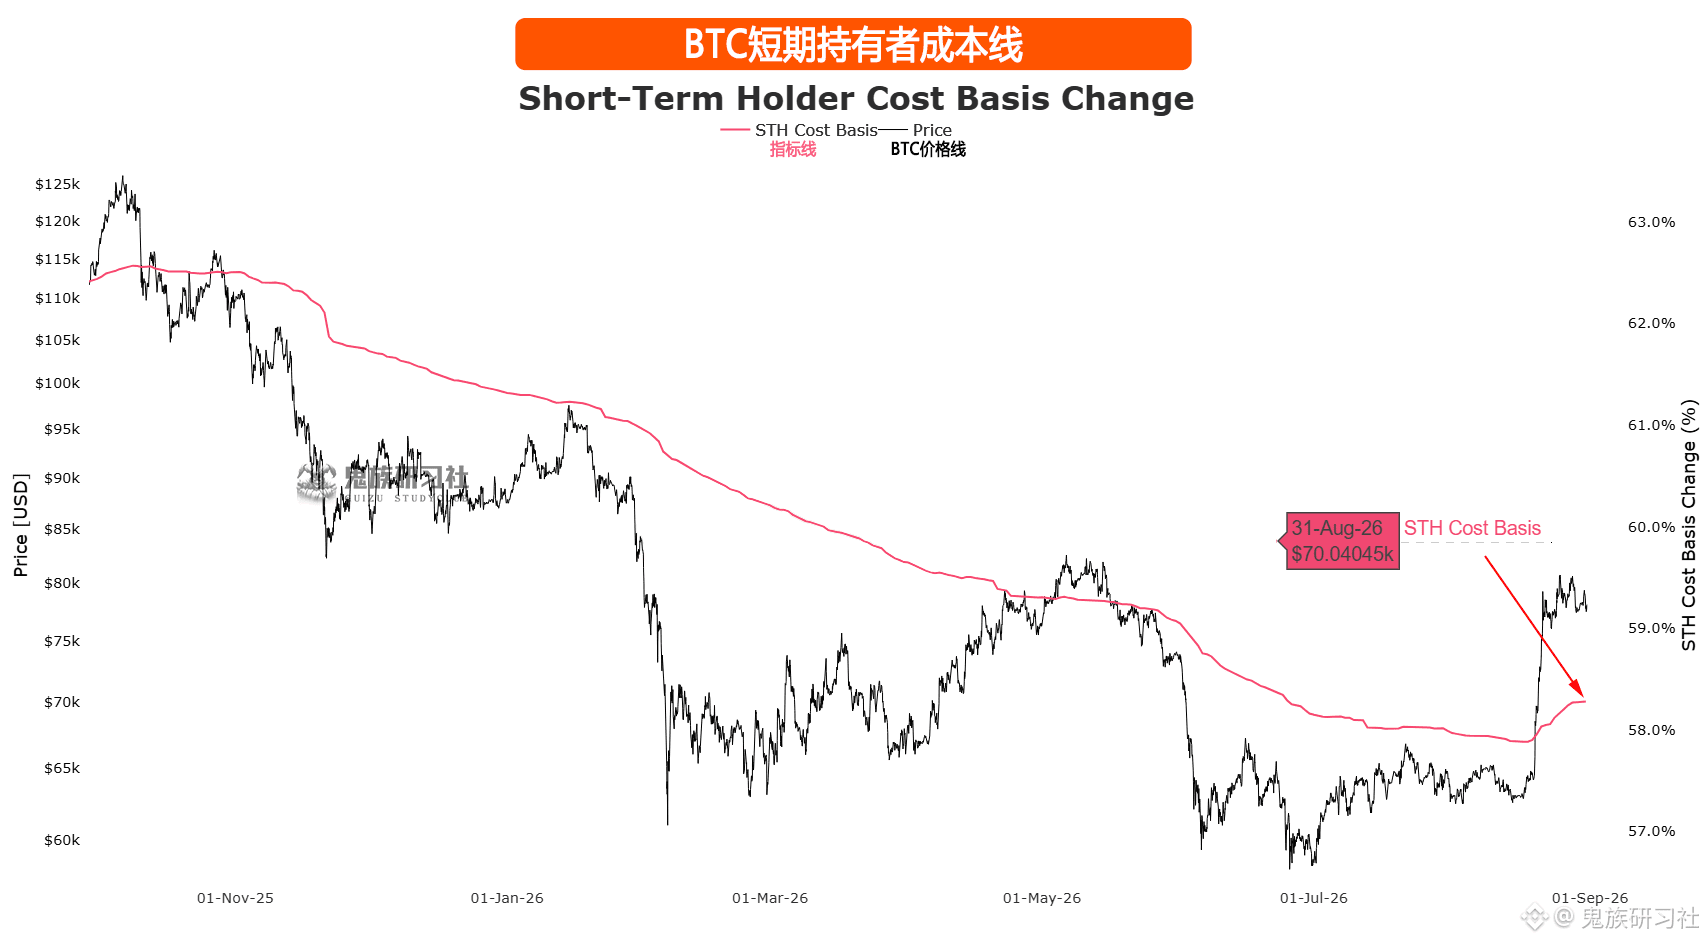
【BTC short-term holder (STH) cost line】Data: currently, the STH average cost is around the 70,000 yuan level. Also, the deviation rate between the current cost line and the price line is relatively large. These two lines will definitely intersect again on some day in the future, and I also believe the cost line will provide some support to the price—after all, it has already been broken through.
Because these two lines will intersect in the future, I think that during the process in which the cost line keeps moving upward, the price will also move downward to get closer. Therefore, in the short term, the probability that the price can keep rising continuously is relatively small; instead, the likelihood of a false breakout or a sustained correction is higher. This is because it takes time for the cost line to move upward. So you don’t necessarily need to blindly go bullish right now. The two selloffs/"dumpings" might actually be signs of a potentially ongoing correction. Go long at lower prices, and avoid chasing from above.
Because these two lines will intersect in the future, I think that during the process in which the cost line keeps moving upward, the price will also move downward to get closer. Therefore, in the short term, the probability that the price can keep rising continuously is relatively small; instead, the likelihood of a false breakout or a sustained correction is higher. This is because it takes time for the cost line to move upward. So you don’t necessarily need to blindly go bullish right now. The two selloffs/"dumpings" might actually be signs of a potentially ongoing correction. Go long at lower prices, and avoid chasing from above.
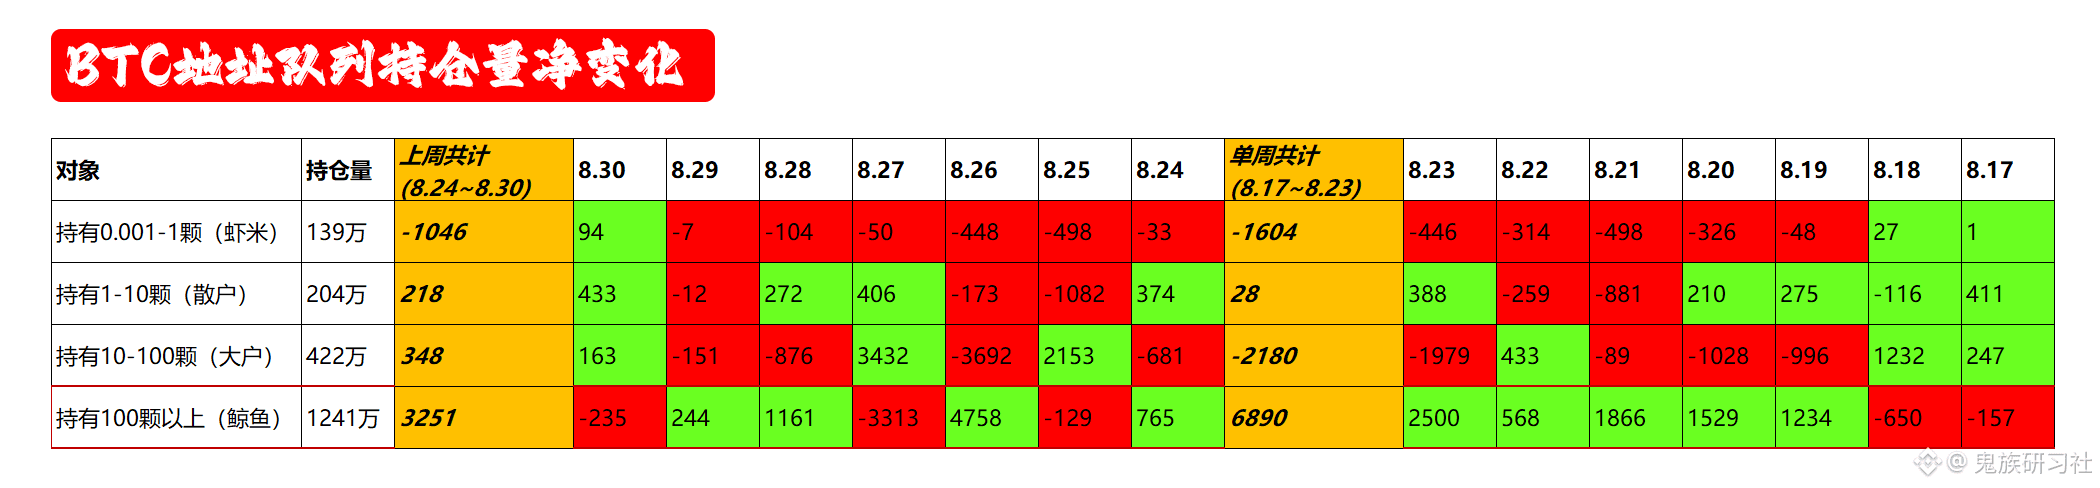
【BTC On-Chain Address Holdings Net Change】In the data, focus on the whale address section. Yesterday, there was a net outflow of 235 coins, but over the course of the entire day, it was a rebound-type market. After midnight, right after 0:00, the price started to fall sharply. So yesterday’s data has some directional significance for today’s行情 (market trend). Of course, this direction has already played out: the whale addresses’ net outflow, and the price also did decline.
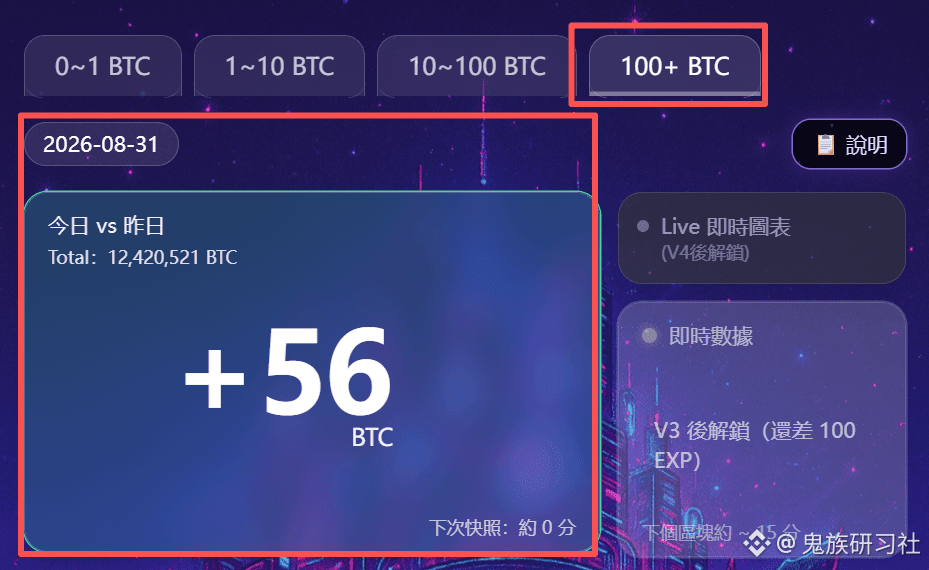
However, as of now, the whale address segment is still showing net inflow. So I think today’s rebound still deserves expectations. The key resistance level above is around the 78,500 area. If there is an effective breakout, the bulls can temporarily hold more steadily.
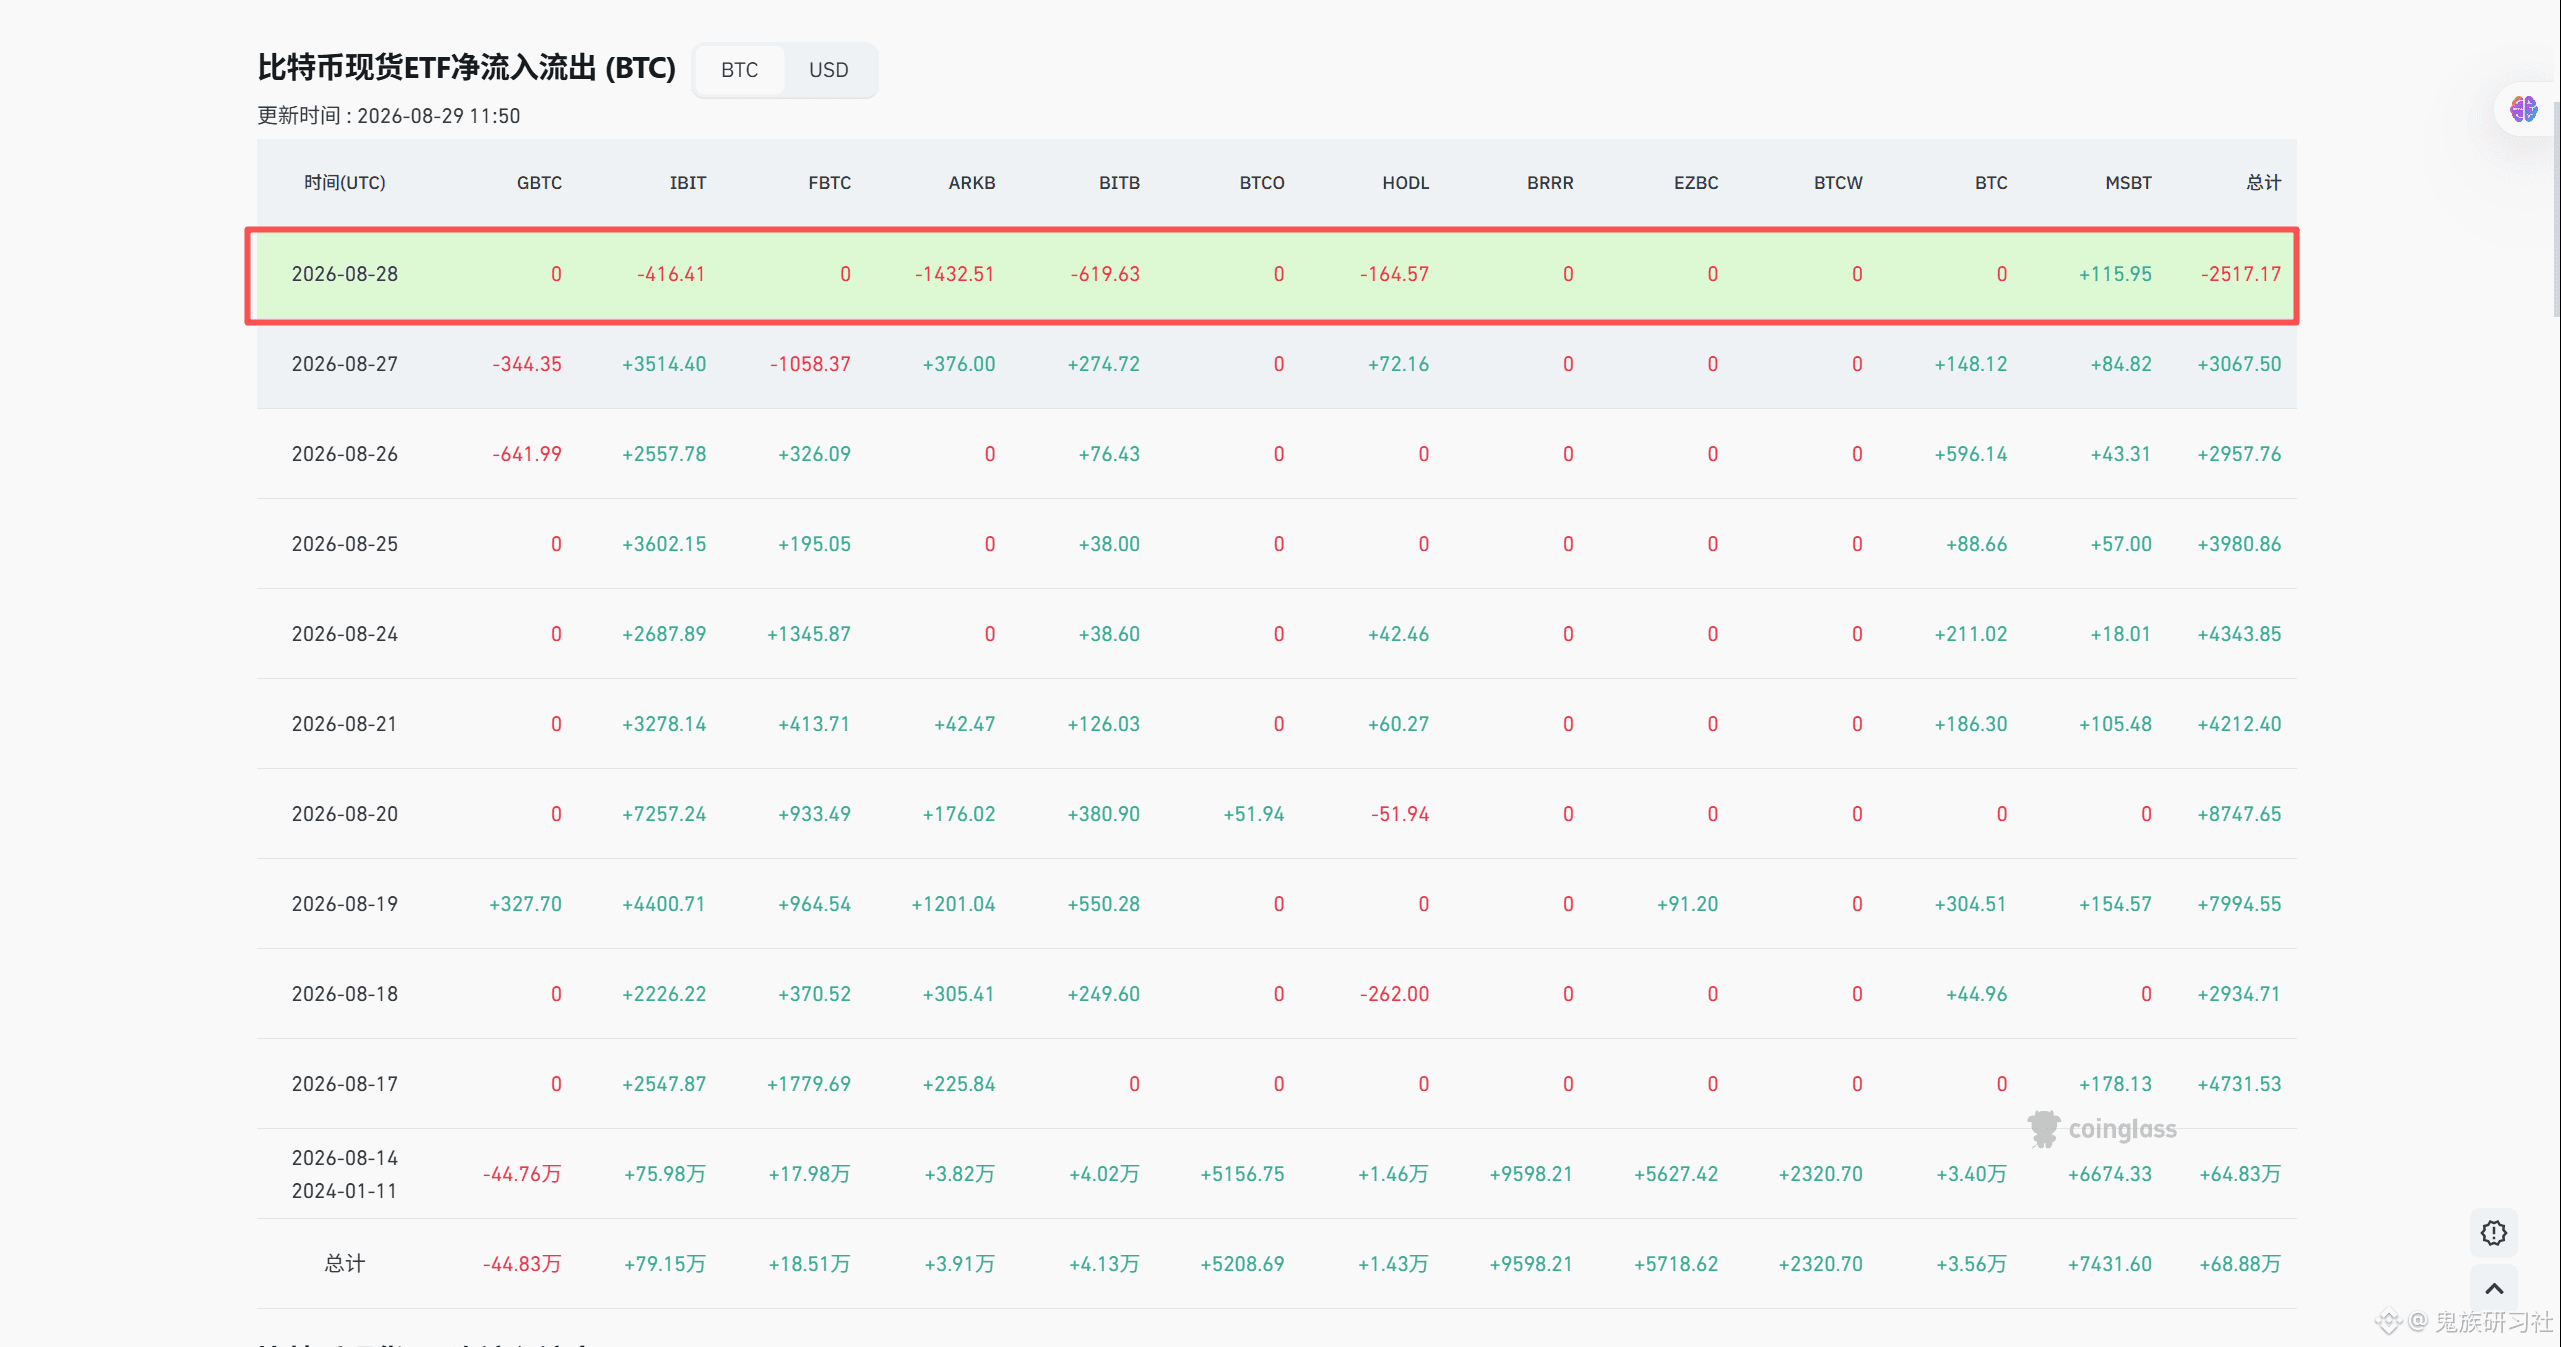
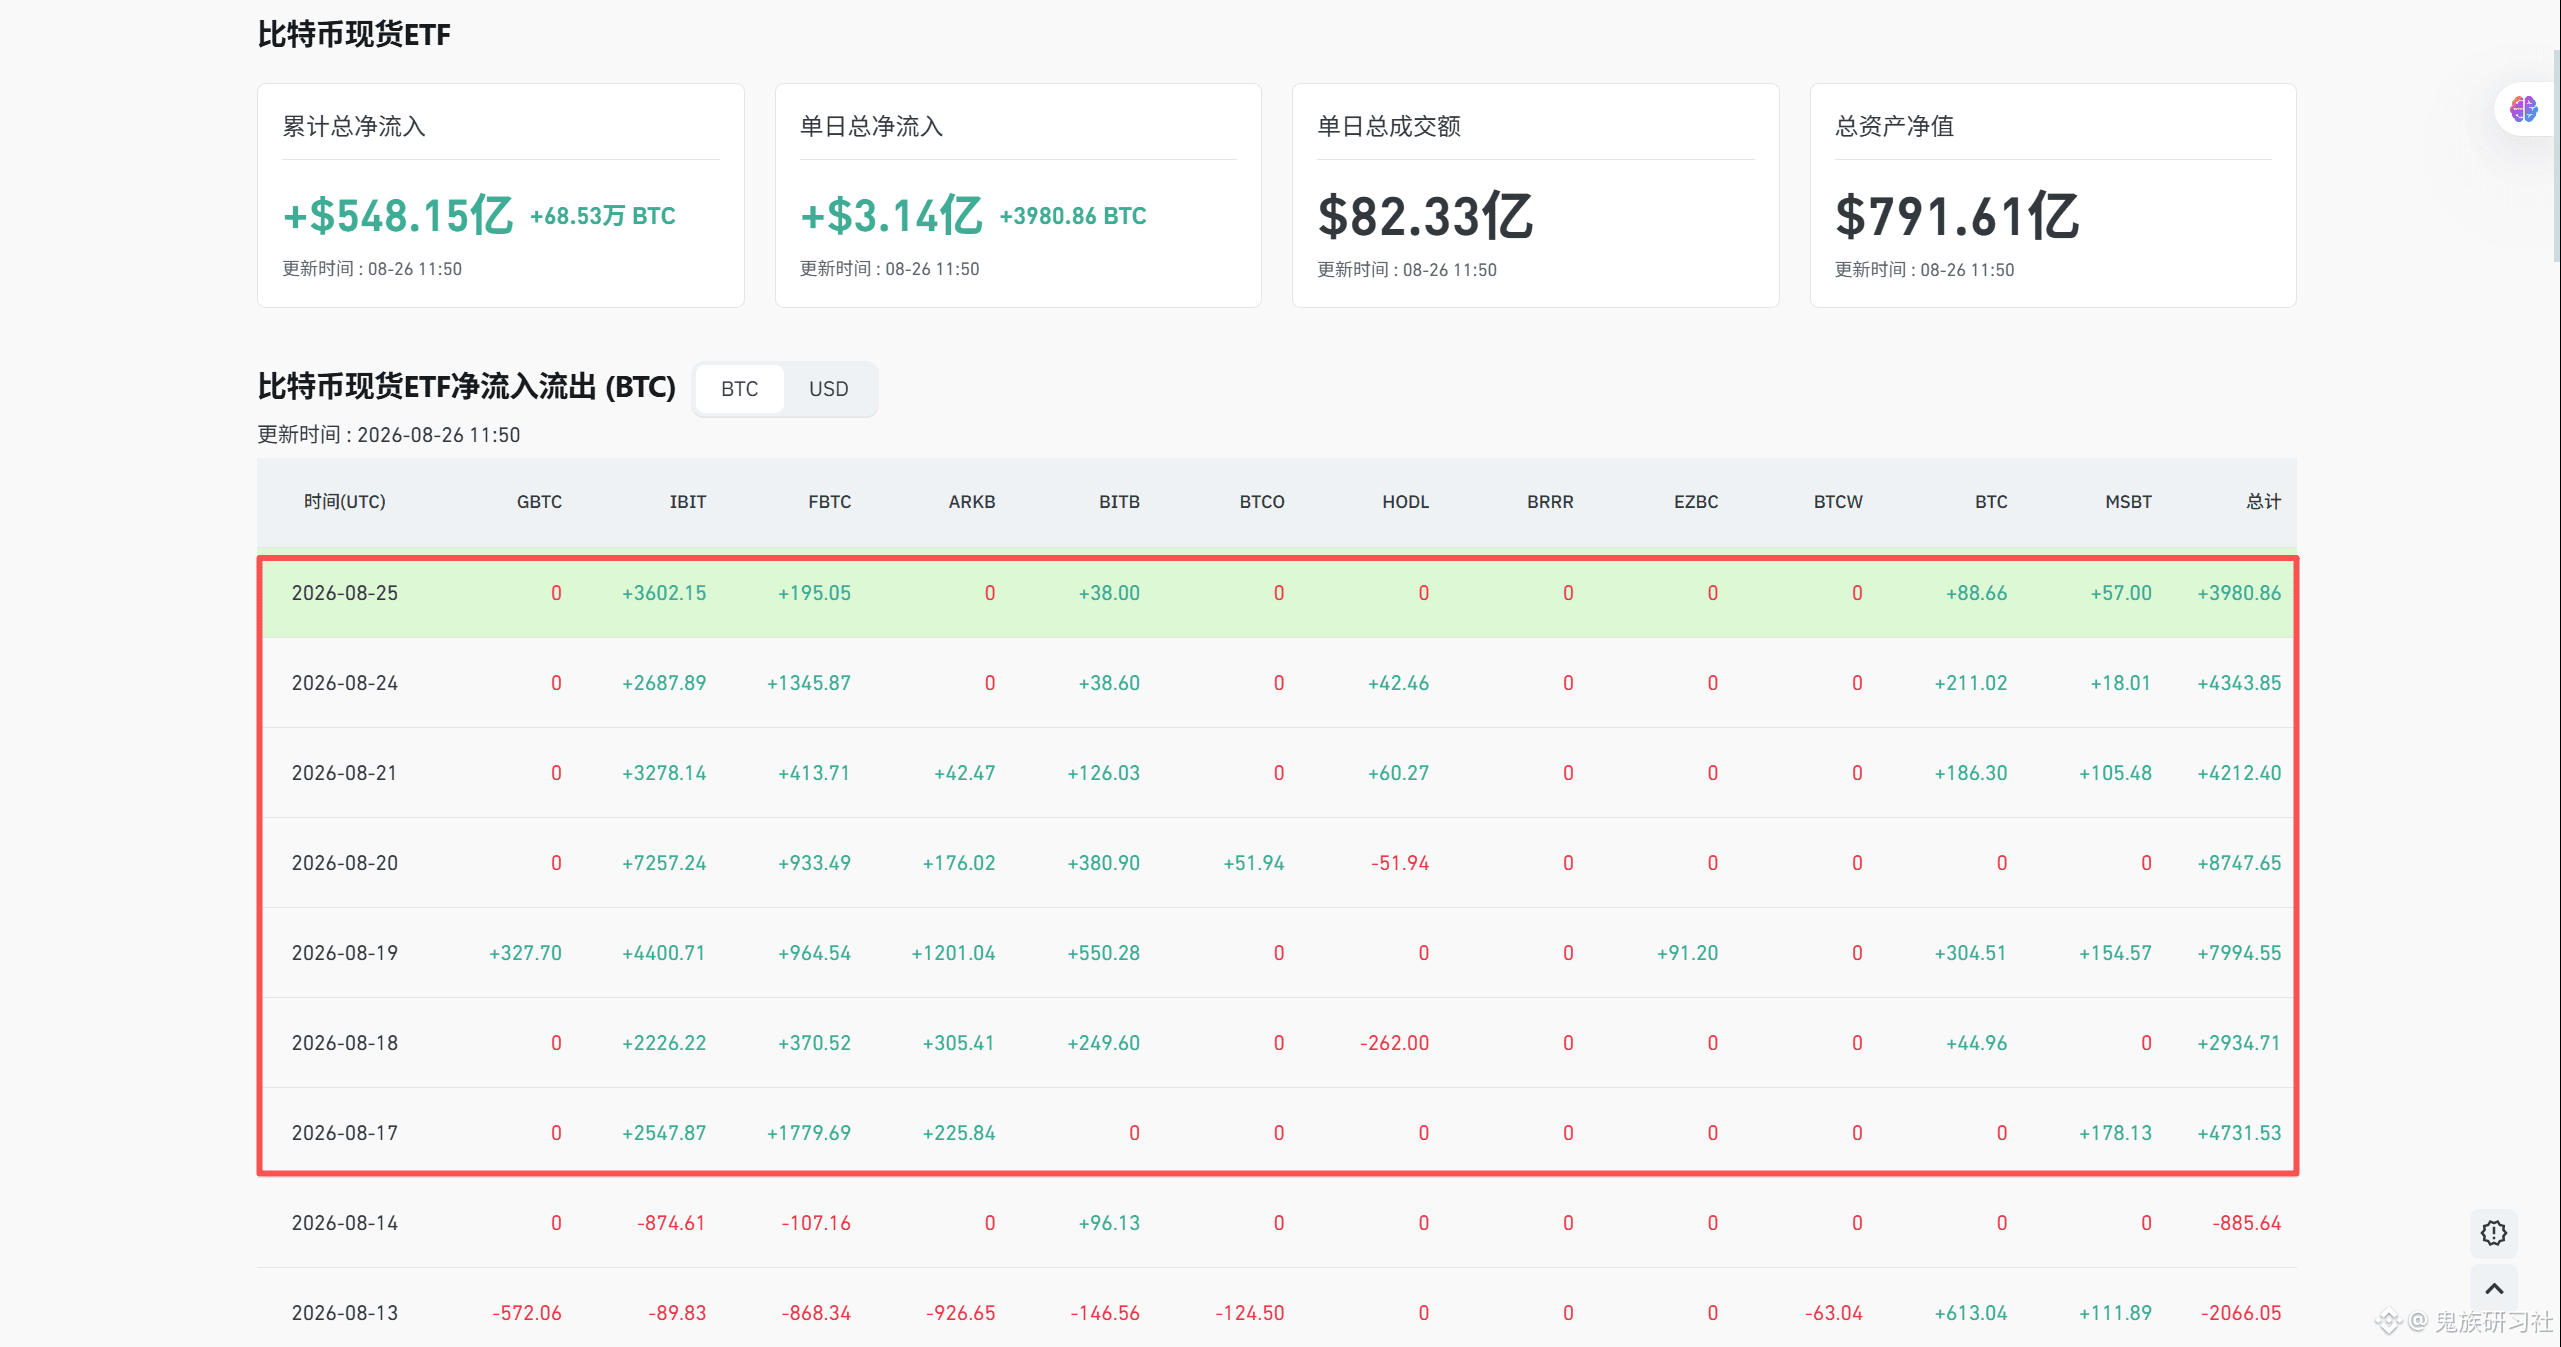
Last Friday, the spot ETF saw net outflows, ending 9 consecutive days of net inflows. This is normal—funds can’t keep net inflow going all the time. Nine straight days is already very impressive and fully reflects an increase in market capital. Therefore, we allow the market to experience a spontaneous net outflow as part of an adjustment, which is very normal. In about three days or so, the ETF funds will still need to resume net inflow behavior. If it continues to be net outflow all the time, then that would be a bit of a problem.
However, as of now, the whale address segment is still showing net inflow. So I think today’s rebound still deserves expectations. The key resistance level above is around the 78,500 area. If there is an effective breakout, the bulls can temporarily hold more steadily.
Last Friday, the spot ETF saw net outflows, ending 9 consecutive days of net inflows. This is normal—funds can’t keep net inflow going all the time. Nine straight days is already very impressive and fully reflects an increase in market capital. Therefore, we allow the market to experience a spontaneous net outflow as part of an adjustment, which is very normal. In about three days or so, the ETF funds will still need to resume net inflow behavior. If it continues to be net outflow all the time, then that would be a bit of a problem.

After the massive sell-off last night, what is most likely the next move?
First, the reason for the sell-off has already been explained in the WeChat public account. Second, whether last night’s wave of selling was driven by the shorts or was actually a wash-out to lure out longs is still difficult to determine. My suggestion is to focus on the key resistance level above—around the 78,500 mark. Right now, the price is rebounding. It depends on whether this small rebound can once again break above and hold firmly at that level, which will determine whether the price can restore an orderly upward trend afterward. Here’s what to watch: if the price cannot even break through the 78,200 level, then—well—let it go down and adjust properly. So, the resistance zone I’m looking at is 【78,200–78,500】.
If today the price doesn’t rise but instead falls and effectively breaks below the 77,500 level, then it could drop toward the target zone 【76,300–76,700】. There is a fairly strong support there. Below that, the next level is around 75,200—but this is still assuming the sell-off is really severe. After that, I won’t look at lower levels for the time being.
Also, if the price re-breaks above the 78,500 level effectively today, fully flipping back up may not be easy. My estimate is that it might only return to around 79,500 and then go in to harvest some additional liquidity.
Overall, I lean toward a sideways-to-bearish outlook. No matter what, for now, we should still respect the sell-off from last night.
First, the reason for the sell-off has already been explained in the WeChat public account. Second, whether last night’s wave of selling was driven by the shorts or was actually a wash-out to lure out longs is still difficult to determine. My suggestion is to focus on the key resistance level above—around the 78,500 mark. Right now, the price is rebounding. It depends on whether this small rebound can once again break above and hold firmly at that level, which will determine whether the price can restore an orderly upward trend afterward. Here’s what to watch: if the price cannot even break through the 78,200 level, then—well—let it go down and adjust properly. So, the resistance zone I’m looking at is 【78,200–78,500】.
If today the price doesn’t rise but instead falls and effectively breaks below the 77,500 level, then it could drop toward the target zone 【76,300–76,700】. There is a fairly strong support there. Below that, the next level is around 75,200—but this is still assuming the sell-off is really severe. After that, I won’t look at lower levels for the time being.
Also, if the price re-breaks above the 78,500 level effectively today, fully flipping back up may not be easy. My estimate is that it might only return to around 79,500 and then go in to harvest some additional liquidity.
Overall, I lean toward a sideways-to-bearish outlook. No matter what, for now, we should still respect the sell-off from last night.

You can’t offend anyone, but you especially can’t offend rich people. Even if you offend a rich person, you still can’t offend the big shot in a particular industry. And even if you offend the top big shot in an industry, you still can’t offend a marketing-born big shot. Jing Tian, how clueless can you be?
Back then, even Wang Sicong, who was at the height of his power, was wary of Jing Tian by three points. Now, however, Sun Ge is directly ripping her apart over a mere 30 million. Is it that Jing Tian has fallen on hard times, or is Sun Ge’s background rock-solid?
Bao Beier cheating, Sun Yuchen suing Jing Tian, and Han Peiying revealing Liu Haocun—could it be that all of these are meant to suppress some truly important information?
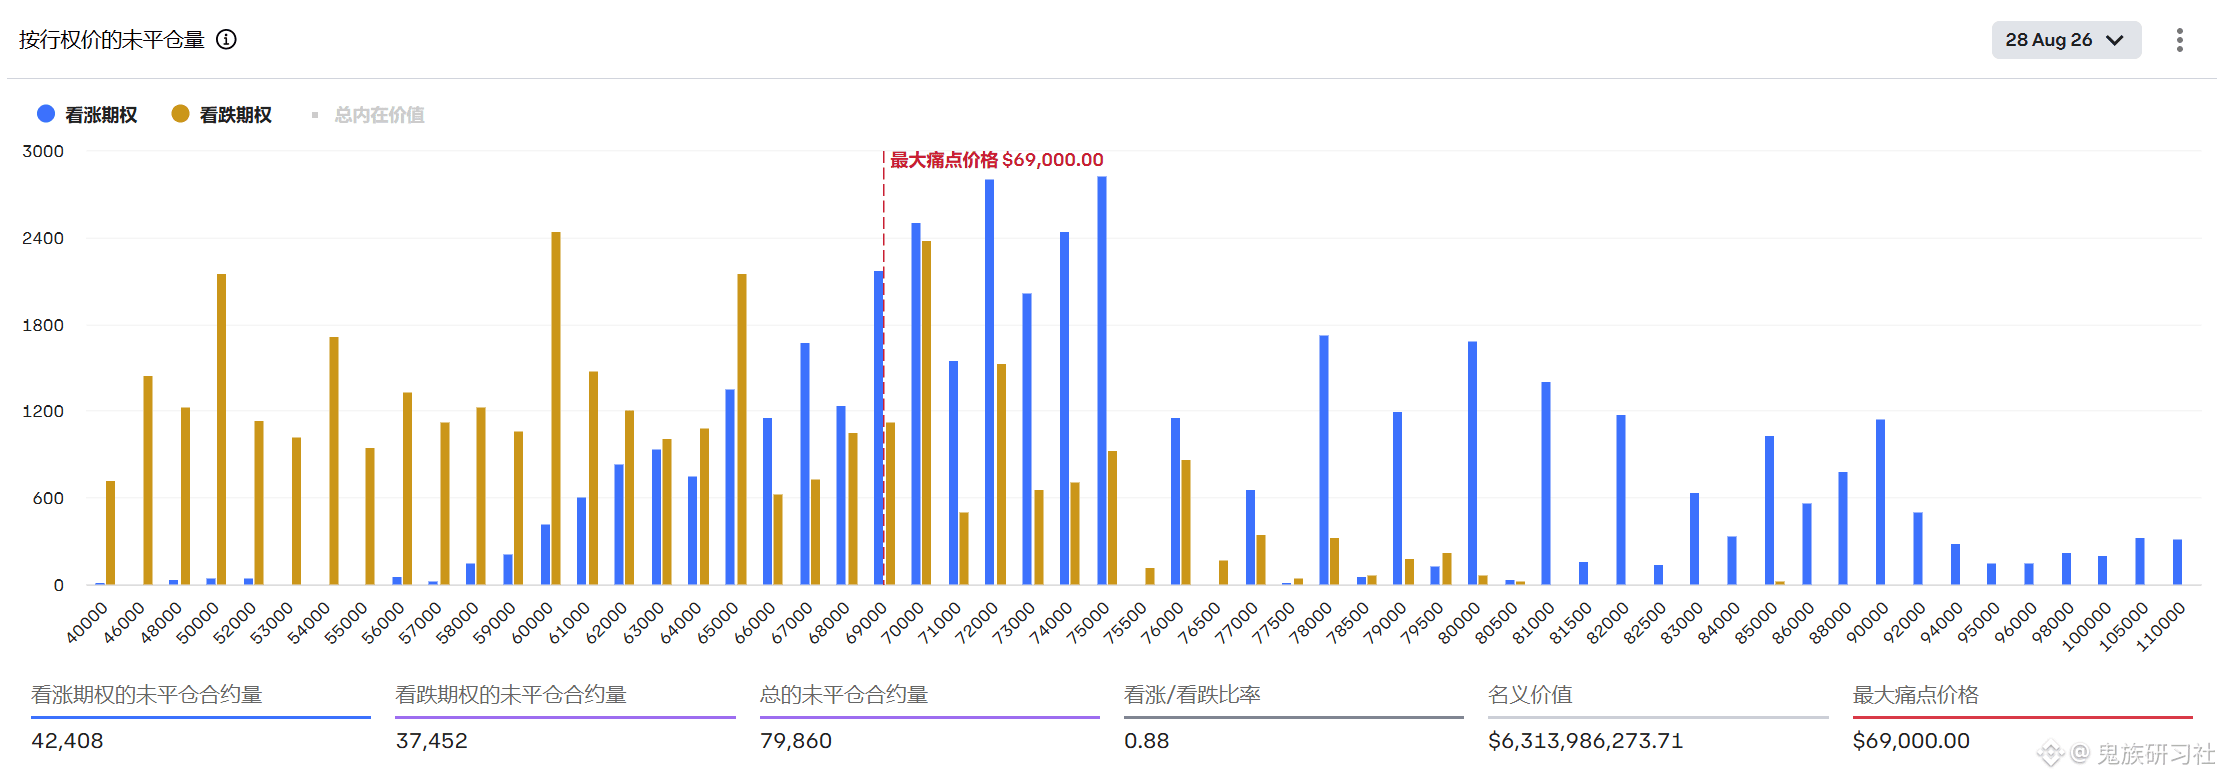
On Friday, Deribit sees the expiry of about 81,700 BTC options, with a notional value of $6.4 billion.
Call options outnumber put options, and the market overall remains bullish. Positions are mainly concentrated around the two levels of $75,000 and $80,000. Before expiry, market makers will repeatedly buy and sell spot to hedge, so prices may be easier to pin around these two levels— or, once a breakout happens, volatility will increase more sharply.
On the macro front, the U.S. Treasury has been buying more long-term Treasuries, pushing yields down; the U.S. dollar has weakened, and people have started buying BTC again as protection against depreciation. Spot ETFs saw inflows of more than $2 billion this week, which explains the quick rise; in terms of liquidity, institutions are still buying. But when the options expire, some people may sell off a portion first.
The medium-term macro environment is improving, and institutions are still entering. The uncertainty is: after the hedge is lifted post-expiry, which direction will the market move? Will U.S. Treasury yields rise again? Could geopolitics suddenly flare up? The key is around the time before and after the 4:00 p.m. settlement on Friday, and also over the following two days.
Call options outnumber put options, and the market overall remains bullish. Positions are mainly concentrated around the two levels of $75,000 and $80,000. Before expiry, market makers will repeatedly buy and sell spot to hedge, so prices may be easier to pin around these two levels— or, once a breakout happens, volatility will increase more sharply.
On the macro front, the U.S. Treasury has been buying more long-term Treasuries, pushing yields down; the U.S. dollar has weakened, and people have started buying BTC again as protection against depreciation. Spot ETFs saw inflows of more than $2 billion this week, which explains the quick rise; in terms of liquidity, institutions are still buying. But when the options expire, some people may sell off a portion first.
The medium-term macro environment is improving, and institutions are still entering. The uncertainty is: after the hedge is lifted post-expiry, which direction will the market move? Will U.S. Treasury yields rise again? Could geopolitics suddenly flare up? The key is around the time before and after the 4:00 p.m. settlement on Friday, and also over the following two days.
Verified
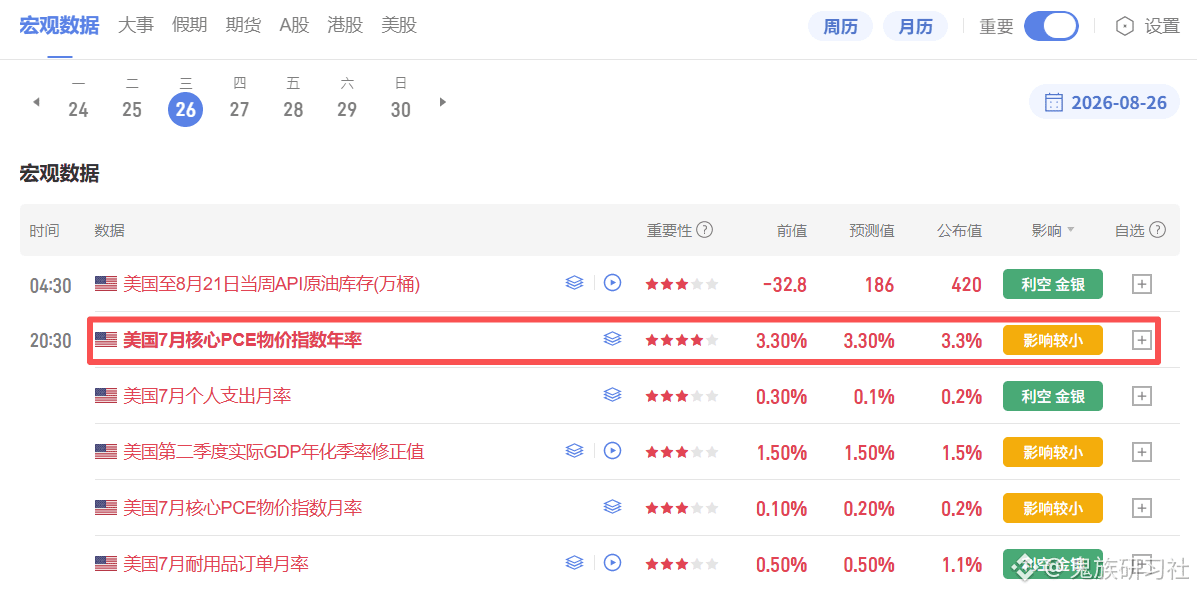
The U.S. PCE data for tonight has been released. Core inflation is in line with expectations, but overall it is still elevated. In July, the core PCE price index rose 0.2% month-on-month and 3.3% year-on-year, both matching market expectations. Total PCE rose 0.2% month-on-month. Actual consumer spending stalled in July after two consecutive months of strong growth. The data suggest the U.S. economy is cooling, which may also strengthen the case for the Federal Reserve to keep interest rates unchanged.
Note: This Friday’s Jackson Hole annual symposium is the real highlight. The theme is “Financial Innovation: The Impact on Payments and Policy.” This is not only the keynote for the annual policy conference, but also, according to Wall Street, the most critical window for Chair Waller—or rather, “Wosh”—to reshape the Fed’s credibility.
Since taking office in May, Waller has deliberately avoided forward guidance and shortened policy statements. The market has interpreted this as a sign of insufficient determination to fight inflation, after which the yield on the 30-year U.S. Treasuries surged at one point to the highest level since 2007, reaching 5.34%.
Goldman Sachs estimates that improving communication could reduce interest-rate volatility by about 10% over the next year, but Waller is moving in the opposite direction.
At the meeting, if Waller provides too little information, the market will be extremely disappointed.
Waller’s remarks likely need to reaffirm three things: inflation risks have not been eliminated, policy rates remain the core tool to combat inflation, and if inflation runs too high again, the Fed will further tighten.
In short, the PCE data are in line with expectations and should have limited impact on the market in the near term. The real test is Waller’s speech on Friday. If he issues clearer policy signals, market volatility will be sharply amplified. If he continues with an ambiguous communication style, the market may be disappointed again and trigger selling.
Whether BTC can hold above $80,000 depends on whether Waller can provide the answers the market wants.
Note: This Friday’s Jackson Hole annual symposium is the real highlight. The theme is “Financial Innovation: The Impact on Payments and Policy.” This is not only the keynote for the annual policy conference, but also, according to Wall Street, the most critical window for Chair Waller—or rather, “Wosh”—to reshape the Fed’s credibility.
Since taking office in May, Waller has deliberately avoided forward guidance and shortened policy statements. The market has interpreted this as a sign of insufficient determination to fight inflation, after which the yield on the 30-year U.S. Treasuries surged at one point to the highest level since 2007, reaching 5.34%.
Goldman Sachs estimates that improving communication could reduce interest-rate volatility by about 10% over the next year, but Waller is moving in the opposite direction.
At the meeting, if Waller provides too little information, the market will be extremely disappointed.
Waller’s remarks likely need to reaffirm three things: inflation risks have not been eliminated, policy rates remain the core tool to combat inflation, and if inflation runs too high again, the Fed will further tighten.
In short, the PCE data are in line with expectations and should have limited impact on the market in the near term. The real test is Waller’s speech on Friday. If he issues clearer policy signals, market volatility will be sharply amplified. If he continues with an ambiguous communication style, the market may be disappointed again and trigger selling.
Whether BTC can hold above $80,000 depends on whether Waller can provide the answers the market wants.
【2026.8.26】Thoughts
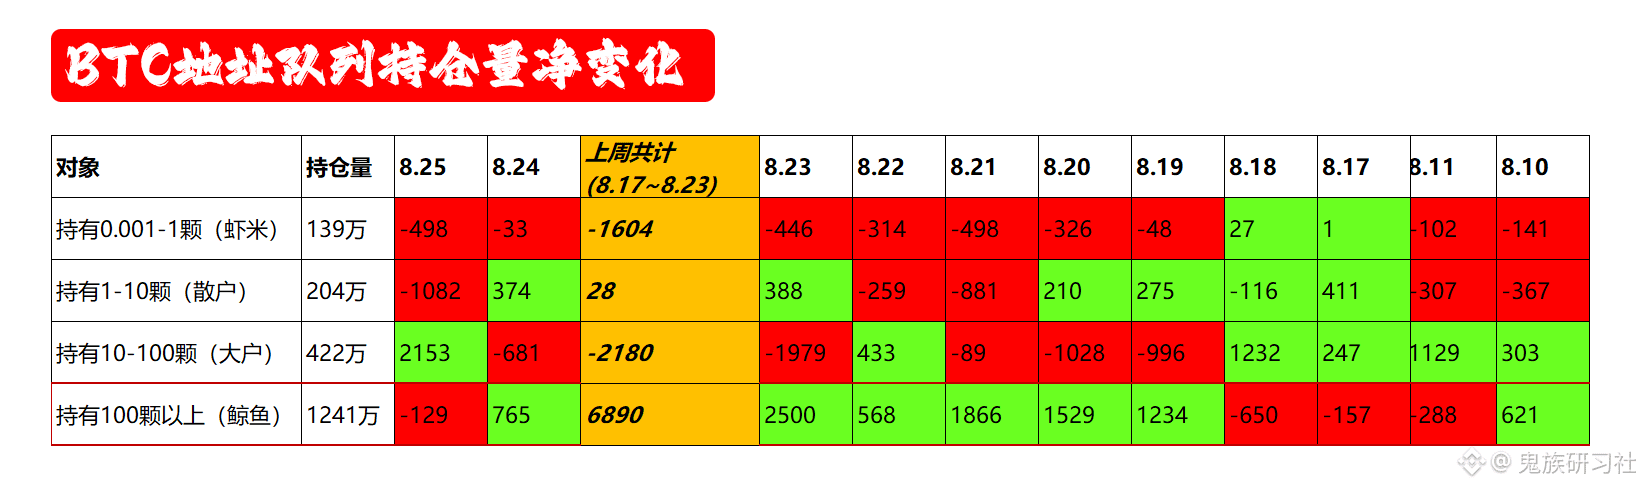
First, look at the whale address section in the chart. Yesterday there was a net outflow of 129 coins. Although the number is small, it ends the trend of net inflows for six consecutive days. That’s not a good sign—it seems more like a potential early signal of a small correction. However, spot ETFs are still continuing to push. Yes, they are pushing, but the price hasn’t risen—it has actually fallen. So for now, there is some selling pressure in the market. But this selling pressure definitely won’t last, because buy-side demand from Europe and the US is there. Therefore, at least in the short term, the high-spirited sentiment won’t easily fade. That said, the market has its own “washout” behavior. We should respect it and not hard-fight against it. As for when the shakeout will be over, let the market decide.
In the recap: Yesterday’s content clearly stated that if it doesn’t rise but instead falls, then it would start a mild adjustment. The target zone for the adjustment is the range 【77800-78600】, and it was noted that 77800 is the last line of defense for short-term longs. The lowest price was around 77850, followed by a rebound to a high point of 79200, and it seems this move may not be finished. So this low-long setup is something you can still profit from.
Back to the chart: Based on the current走势, my views are:
1、The 77800 level is still a position that short-term longs need to defend. If it is effectively broken, then the depth of the adjustment and the time scale will expand, potentially pushing down into the range 【76200-76700】. That is the target for the bigger correction, the next key support level, and also another opportunity to go long on dips for the bulls.
2、If the price wants to turn the rebound into an uptrend, it must effectively break through the key resistance at 79500. Only after breaking and holding above this level can the price regain its upward order and launch another attack toward the previous high, or even new highs. If short-term longs fail to do that, and instead meet resistance and pull back, then—as mentioned in point 1—it would likely enter a deeper correction. But one saying remains unchanged for now: small falls, small buys; big falls, big buys.
In summary, for reference only.
First, look at the whale address section in the chart. Yesterday there was a net outflow of 129 coins. Although the number is small, it ends the trend of net inflows for six consecutive days. That’s not a good sign—it seems more like a potential early signal of a small correction. However, spot ETFs are still continuing to push. Yes, they are pushing, but the price hasn’t risen—it has actually fallen. So for now, there is some selling pressure in the market. But this selling pressure definitely won’t last, because buy-side demand from Europe and the US is there. Therefore, at least in the short term, the high-spirited sentiment won’t easily fade. That said, the market has its own “washout” behavior. We should respect it and not hard-fight against it. As for when the shakeout will be over, let the market decide.
In the recap: Yesterday’s content clearly stated that if it doesn’t rise but instead falls, then it would start a mild adjustment. The target zone for the adjustment is the range 【77800-78600】, and it was noted that 77800 is the last line of defense for short-term longs. The lowest price was around 77850, followed by a rebound to a high point of 79200, and it seems this move may not be finished. So this low-long setup is something you can still profit from.
Back to the chart: Based on the current走势, my views are:
1、The 77800 level is still a position that short-term longs need to defend. If it is effectively broken, then the depth of the adjustment and the time scale will expand, potentially pushing down into the range 【76200-76700】. That is the target for the bigger correction, the next key support level, and also another opportunity to go long on dips for the bulls.
2、If the price wants to turn the rebound into an uptrend, it must effectively break through the key resistance at 79500. Only after breaking and holding above this level can the price regain its upward order and launch another attack toward the previous high, or even new highs. If short-term longs fail to do that, and instead meet resistance and pull back, then—as mentioned in point 1—it would likely enter a deeper correction. But one saying remains unchanged for now: small falls, small buys; big falls, big buys.
In summary, for reference only.
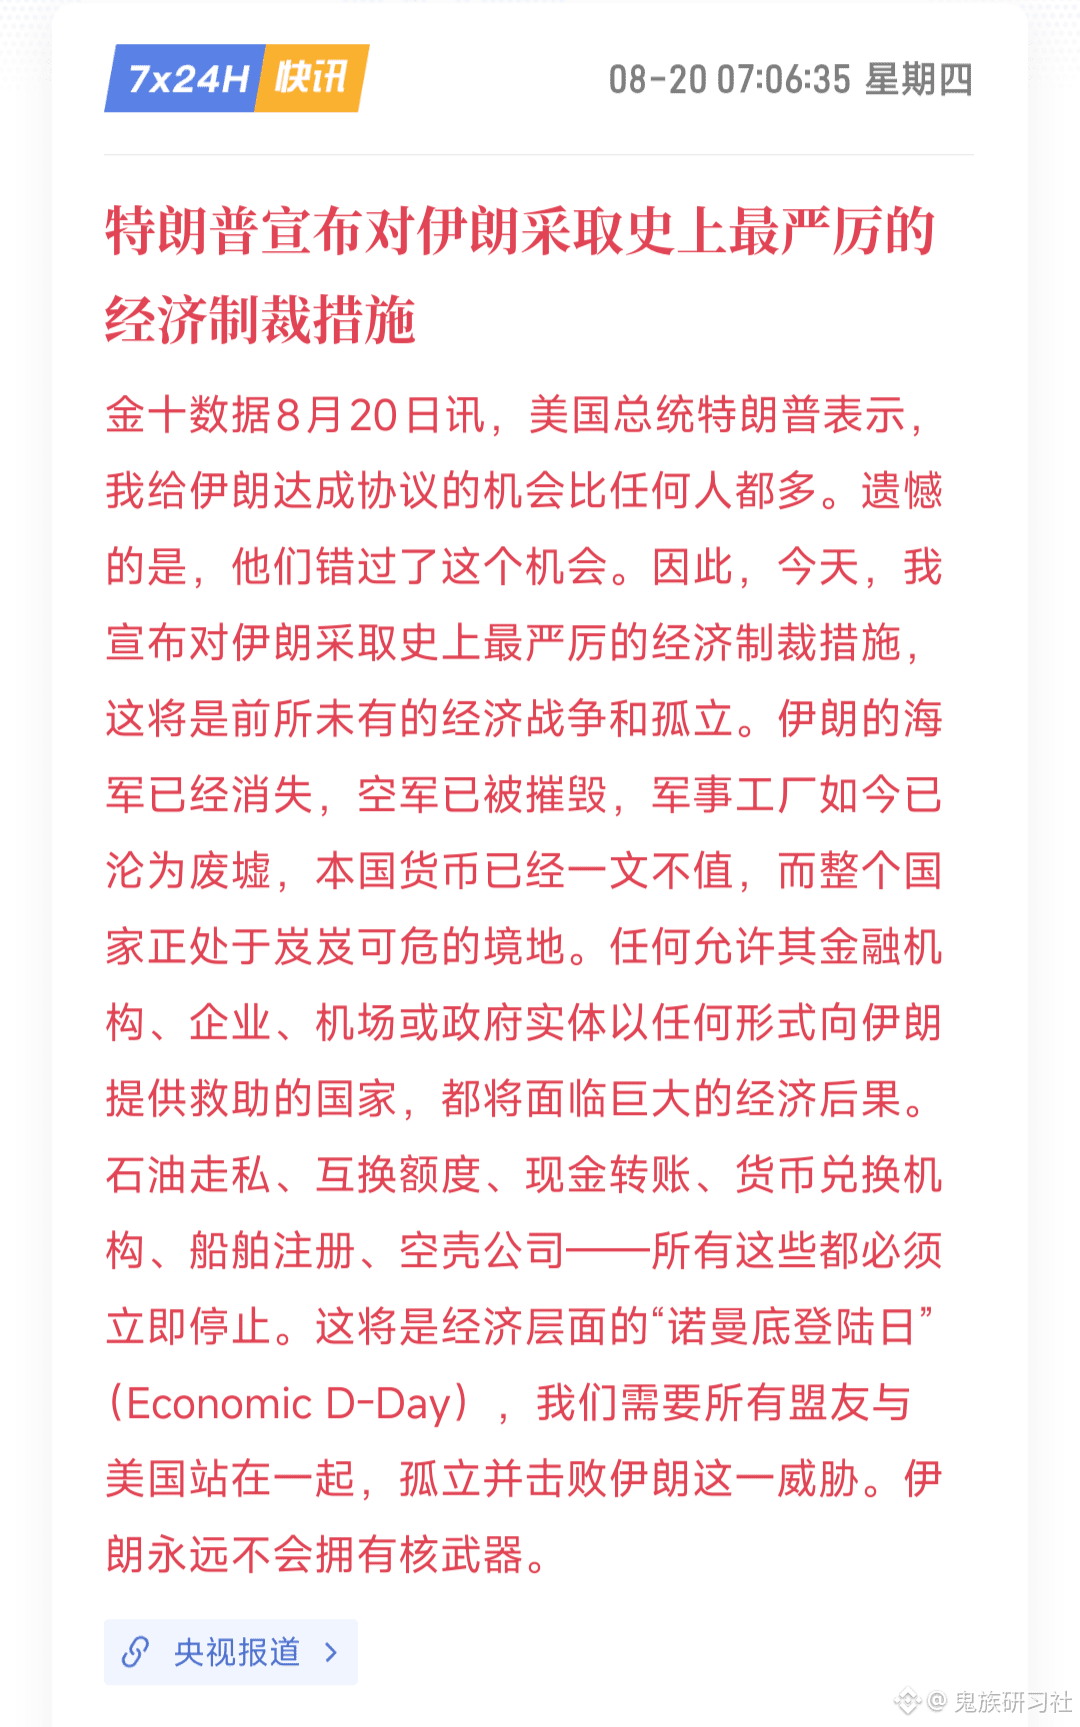
2:00 AM Beijing time on August 25, the U.S. Treasury Secretary Bessent officially announced the imposition of “the strictest sanctions in history” on Iran.
Bessent said this is the largest coordinated economic isolation action in human history, and the core of it is to force all countries and companies worldwide to take sides between the United States and Iran.
The sanctions target three types of economic and trade activities: buying Iranian oil, sending remittances to Iran, and maritime transshipment of Iranian crude oil. Any country or company that continues doing business with Iran will face the U.S.’s secondary sanctions.
Iran’s Supreme National Security Council Secretary Rezaei warned that if the United States continues its economic war, Iran will blockade the oil transportation through the Strait of Hormuz, adding that no drop of oil will be exported through the Strait of Hormuz and even the Persian Gulf region. Any country that participates in or supports the United States’ economic war against Iran will be viewed by Iran as an enemy.
This round of sanctions was announced by Trump on August 19. At the time, his exact words were that the U.S. would launch “the most destructive economic action ever, aimed at a country.” U.S. Treasury Secretary Bessent immediately confirmed it, and then will officially release the specific measures on August 24–25.
Now the strictest sanctions are about to land—the short-term uncertainty is basically gone. Interestingly, some funds are once again choosing to move in.
So even if the specific operations are announced tonight at 2:00 AM, the impact on the BTC price should be limited.
What matters more, though, is oil prices—the real hidden risk.
Brent crude oil is currently above $92 per barrel, and Iranian oil exports have plunged from about 2.0 million barrels per day before the war to 287,000 barrels. If the Strait of Hormuz is truly blocked, oil prices would keep surging, and inflation pressure would continue to make it harder for the Federal Reserve to ease policy. Rate-hike expectations would return—this is the real pressure on BTC.
Whether the short-term rebound brought by the sanctions actually holds will depend on whether oil prices can stabilize.
Bessent said this is the largest coordinated economic isolation action in human history, and the core of it is to force all countries and companies worldwide to take sides between the United States and Iran.
The sanctions target three types of economic and trade activities: buying Iranian oil, sending remittances to Iran, and maritime transshipment of Iranian crude oil. Any country or company that continues doing business with Iran will face the U.S.’s secondary sanctions.
Iran’s Supreme National Security Council Secretary Rezaei warned that if the United States continues its economic war, Iran will blockade the oil transportation through the Strait of Hormuz, adding that no drop of oil will be exported through the Strait of Hormuz and even the Persian Gulf region. Any country that participates in or supports the United States’ economic war against Iran will be viewed by Iran as an enemy.
This round of sanctions was announced by Trump on August 19. At the time, his exact words were that the U.S. would launch “the most destructive economic action ever, aimed at a country.” U.S. Treasury Secretary Bessent immediately confirmed it, and then will officially release the specific measures on August 24–25.
Now the strictest sanctions are about to land—the short-term uncertainty is basically gone. Interestingly, some funds are once again choosing to move in.
So even if the specific operations are announced tonight at 2:00 AM, the impact on the BTC price should be limited.
What matters more, though, is oil prices—the real hidden risk.
Brent crude oil is currently above $92 per barrel, and Iranian oil exports have plunged from about 2.0 million barrels per day before the war to 287,000 barrels. If the Strait of Hormuz is truly blocked, oil prices would keep surging, and inflation pressure would continue to make it harder for the Federal Reserve to ease policy. Rate-hike expectations would return—this is the real pressure on BTC.
Whether the short-term rebound brought by the sanctions actually holds will depend on whether oil prices can stabilize.


Last night at 2:00, the U.S. Federal Reserve released the minutes of the July FOMC meeting, sending out a somewhat hawkish signal. The minutes showed that many officials believed that if inflation cannot be brought down, further tightening of monetary policy would be necessary. The meeting kept the interest rate unchanged at 3.50% to 3.75%, with a vote of 9 to 3; three regional Fed presidents cast dissenting votes, calling for a 25-basis-point rate hike.
The minutes did not mention any views supporting rate cuts. Several officials warned that elevated AI valuations and the expansion of lending-backed financing are being transmitted from the equity market into the credit system. The Middle East conflict was listed as a major source of uncertainty for the inflation outlook. CME data showed that the probability of a rate hike in September was still as high as 32.7%.
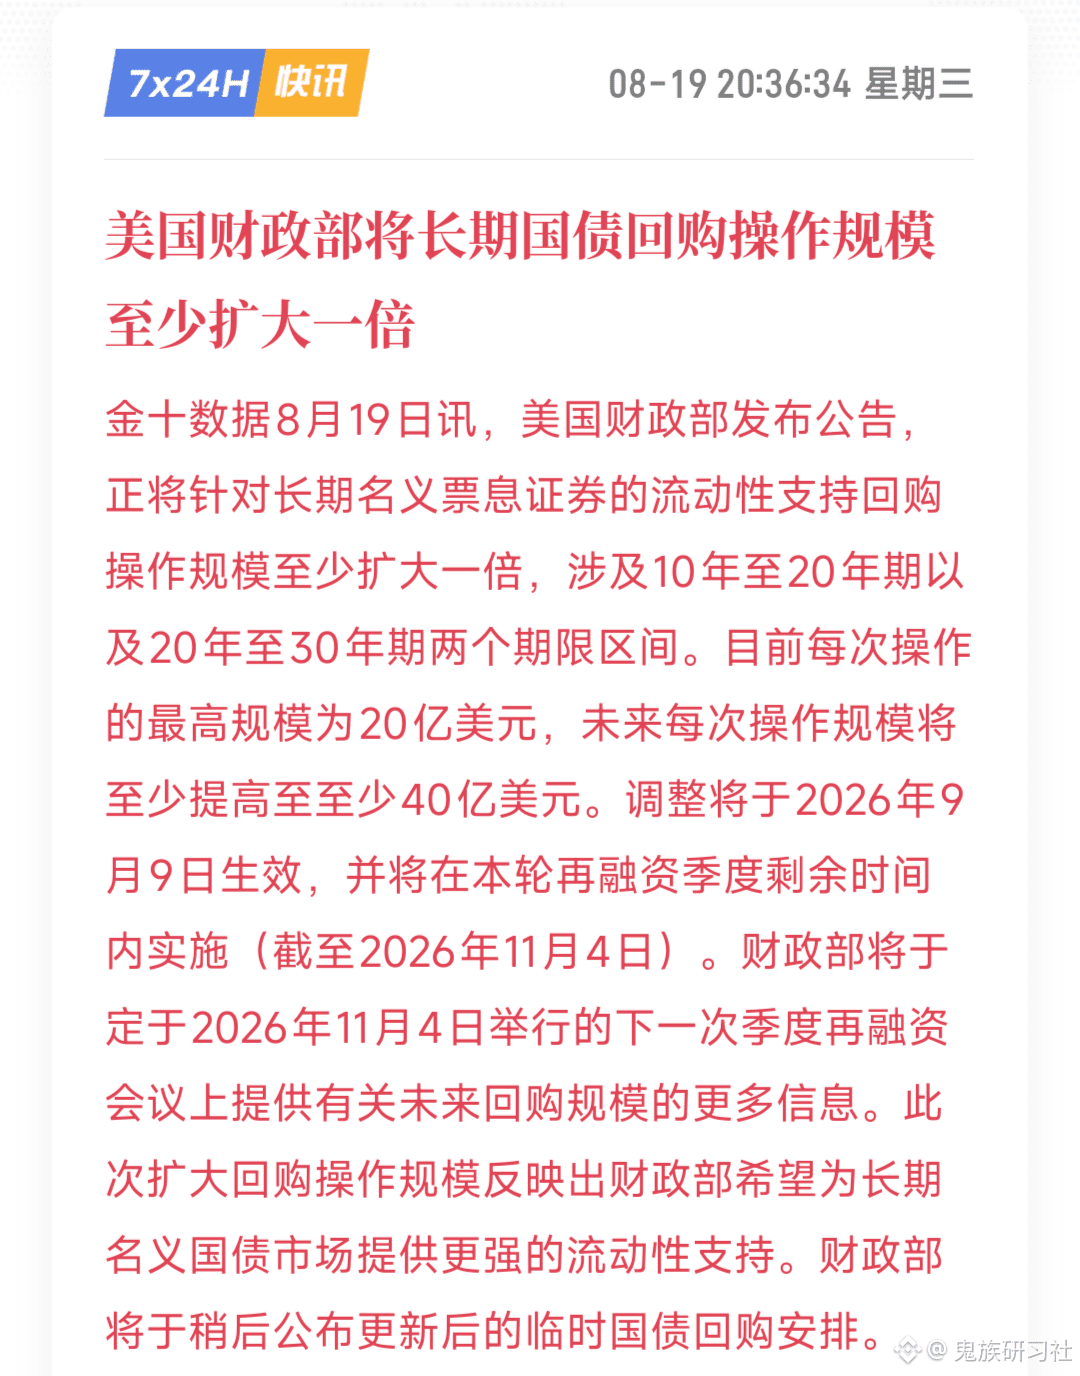
The strange part is that while the minutes were hawkish, BTC still surged sharply. The core reason is the three forces mentioned in the previous section, which outweighed the bearish takeaways from the minutes. First, the U.S. Treasury announced a major expansion of its Treasury bill repurchase program, adding a large amount of liquidity to the market. Next, the epic-level short squeeze was still building. Earlier bearish positions that had been concentrated were closed out over the past few months; price strength triggered a chain of liquidations, and passive buying further amplified the rally. Then there was the proposal by Wosh to reduce the Fed’s number of policy meetings from eight times per year to six. The market interpreted this as the Fed entering a “quieter” mode—fewer decision points would actually reduce the frequency of policy disruptions.
So, the sharp surge, in essence, was that macro factors (the Treasury’s repo expansion + fewer Fed meeting days) outweighed the hawkish wording in the minutes themselves, and combined with the technical factors of shorts being forced to cover, together pushing BTC into a round of explosive rally.
But the risk of rate hikes has not disappeared, and the shadow of geopolitical conflict still lingers. Stay cautious—don’t get overheated.
The minutes did not mention any views supporting rate cuts. Several officials warned that elevated AI valuations and the expansion of lending-backed financing are being transmitted from the equity market into the credit system. The Middle East conflict was listed as a major source of uncertainty for the inflation outlook. CME data showed that the probability of a rate hike in September was still as high as 32.7%.
The strange part is that while the minutes were hawkish, BTC still surged sharply. The core reason is the three forces mentioned in the previous section, which outweighed the bearish takeaways from the minutes. First, the U.S. Treasury announced a major expansion of its Treasury bill repurchase program, adding a large amount of liquidity to the market. Next, the epic-level short squeeze was still building. Earlier bearish positions that had been concentrated were closed out over the past few months; price strength triggered a chain of liquidations, and passive buying further amplified the rally. Then there was the proposal by Wosh to reduce the Fed’s number of policy meetings from eight times per year to six. The market interpreted this as the Fed entering a “quieter” mode—fewer decision points would actually reduce the frequency of policy disruptions.
So, the sharp surge, in essence, was that macro factors (the Treasury’s repo expansion + fewer Fed meeting days) outweighed the hawkish wording in the minutes themselves, and combined with the technical factors of shorts being forced to cover, together pushing BTC into a round of explosive rally.
But the risk of rate hikes has not disappeared, and the shadow of geopolitical conflict still lingers. Stay cautious—don’t get overheated.
Log in to explore more content