🔥🔥$BTC price analysis from current market trend.🔥🔥
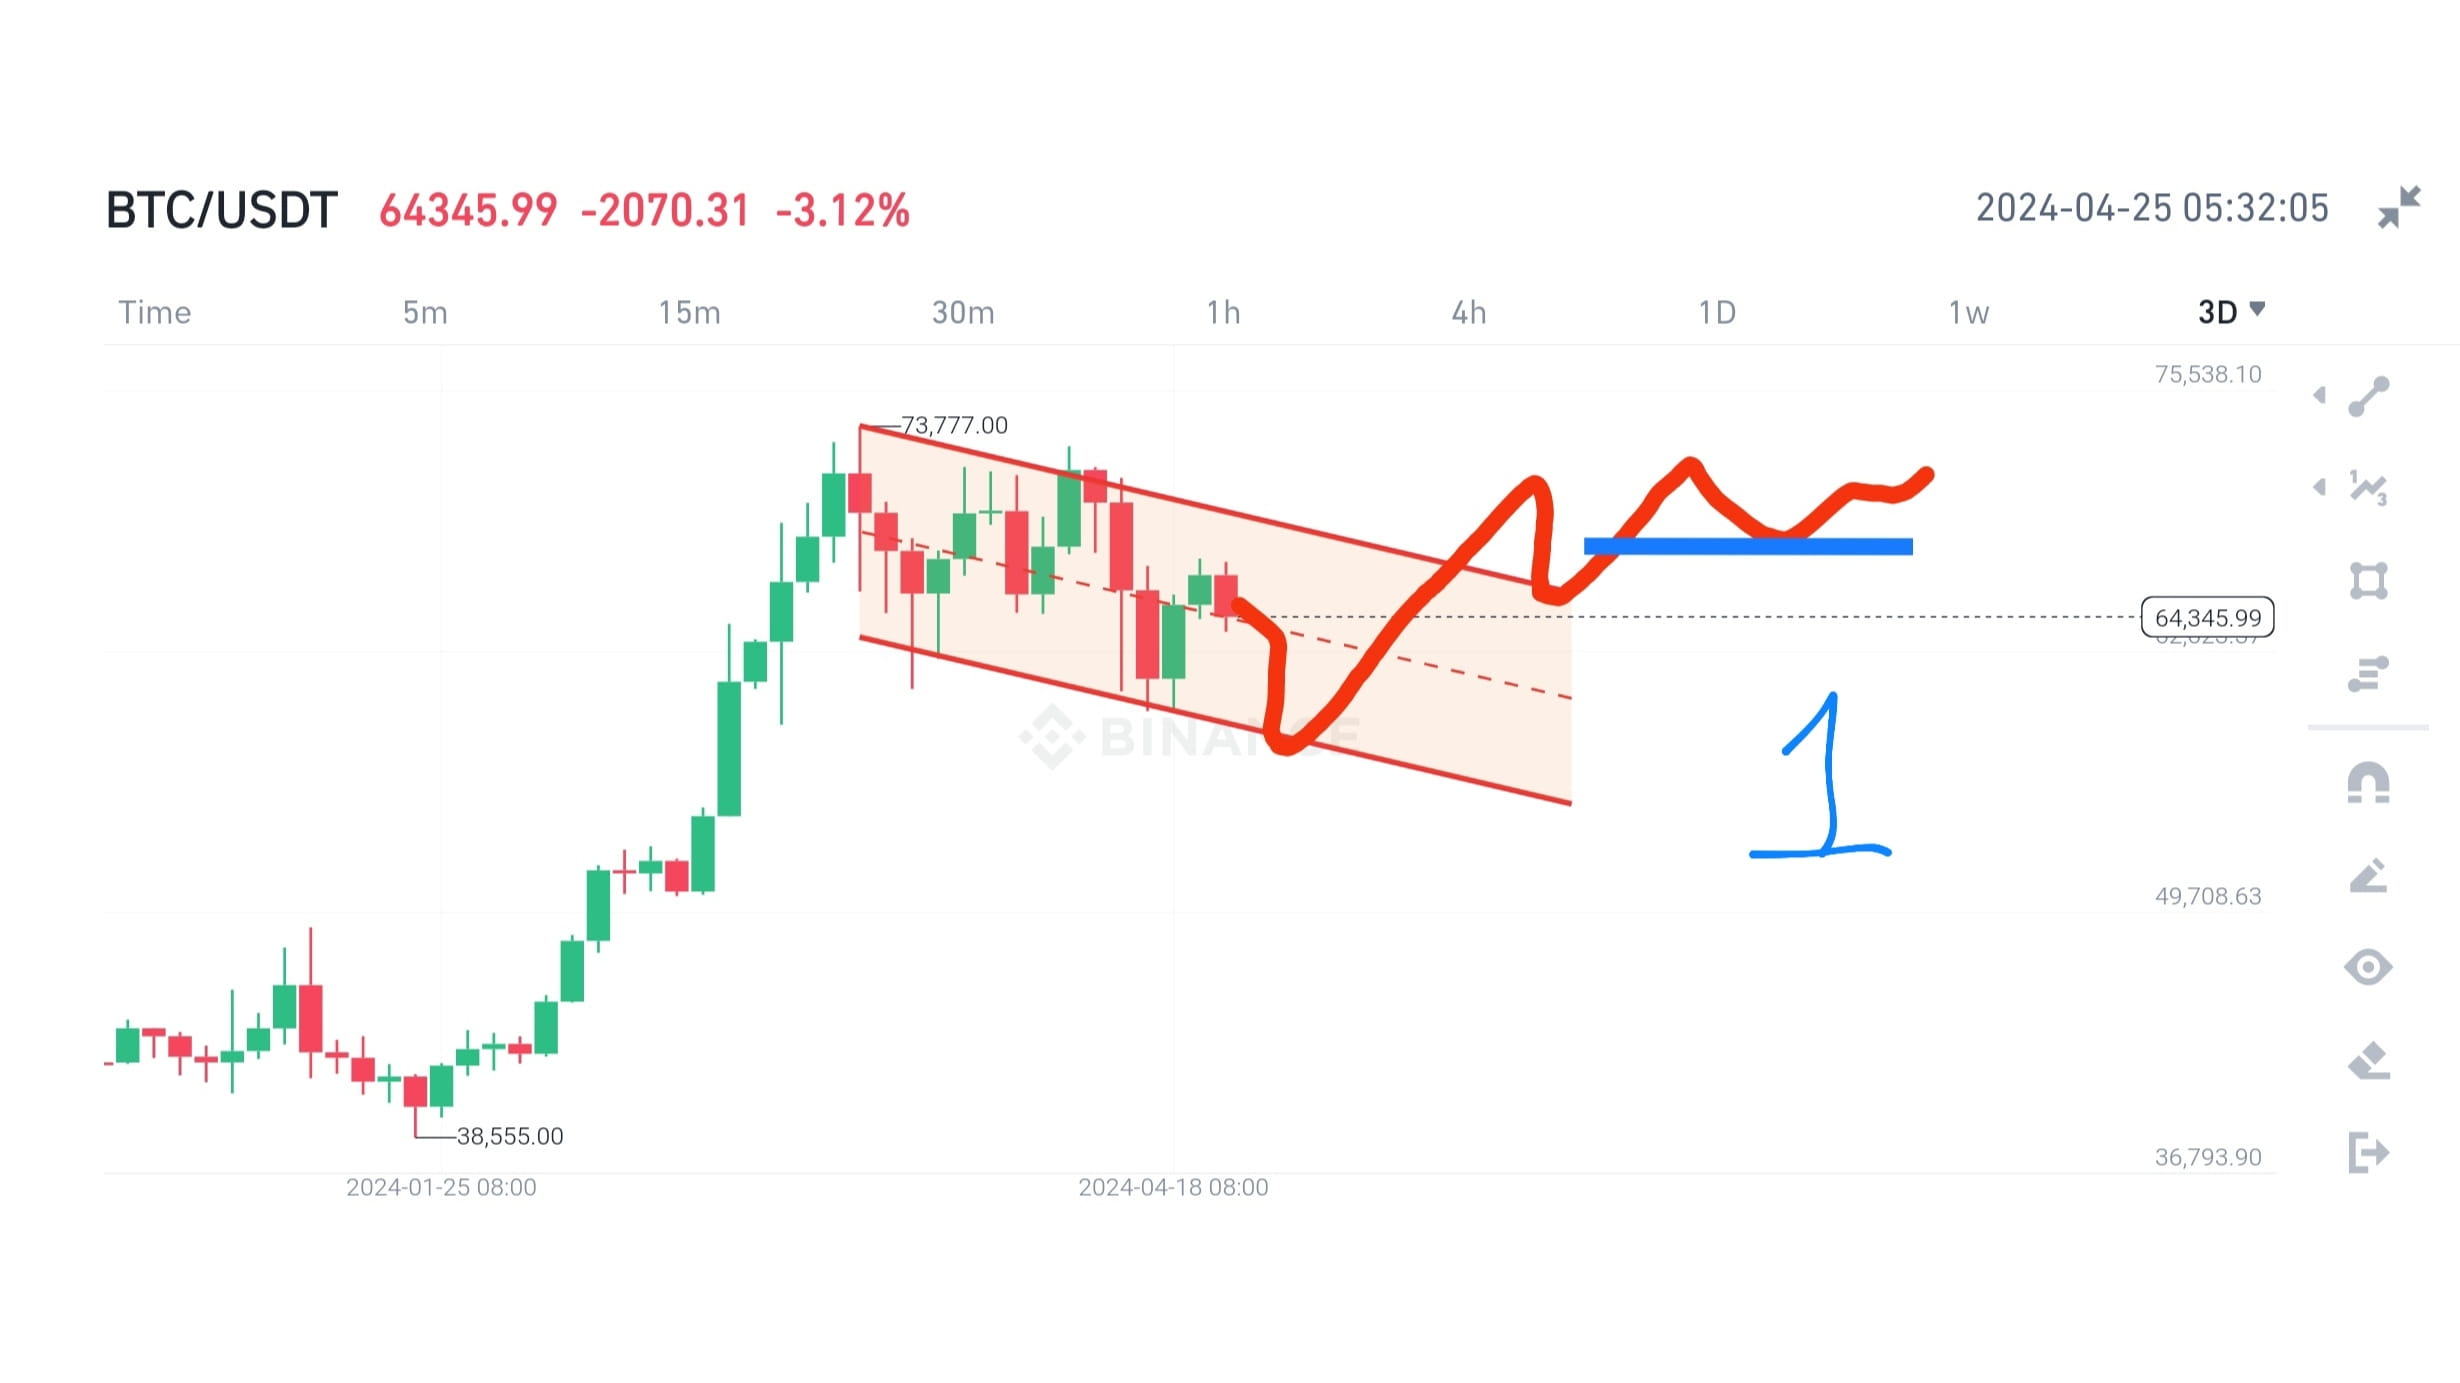
✅ Figure-1 shows that #BTC on the central support of descending channel represented by dashed line. If $BTC breaks the current zone it might test bottom support of the channel. If bulls are able to hold the support line then the price will possibly rebound and continue to move upward.
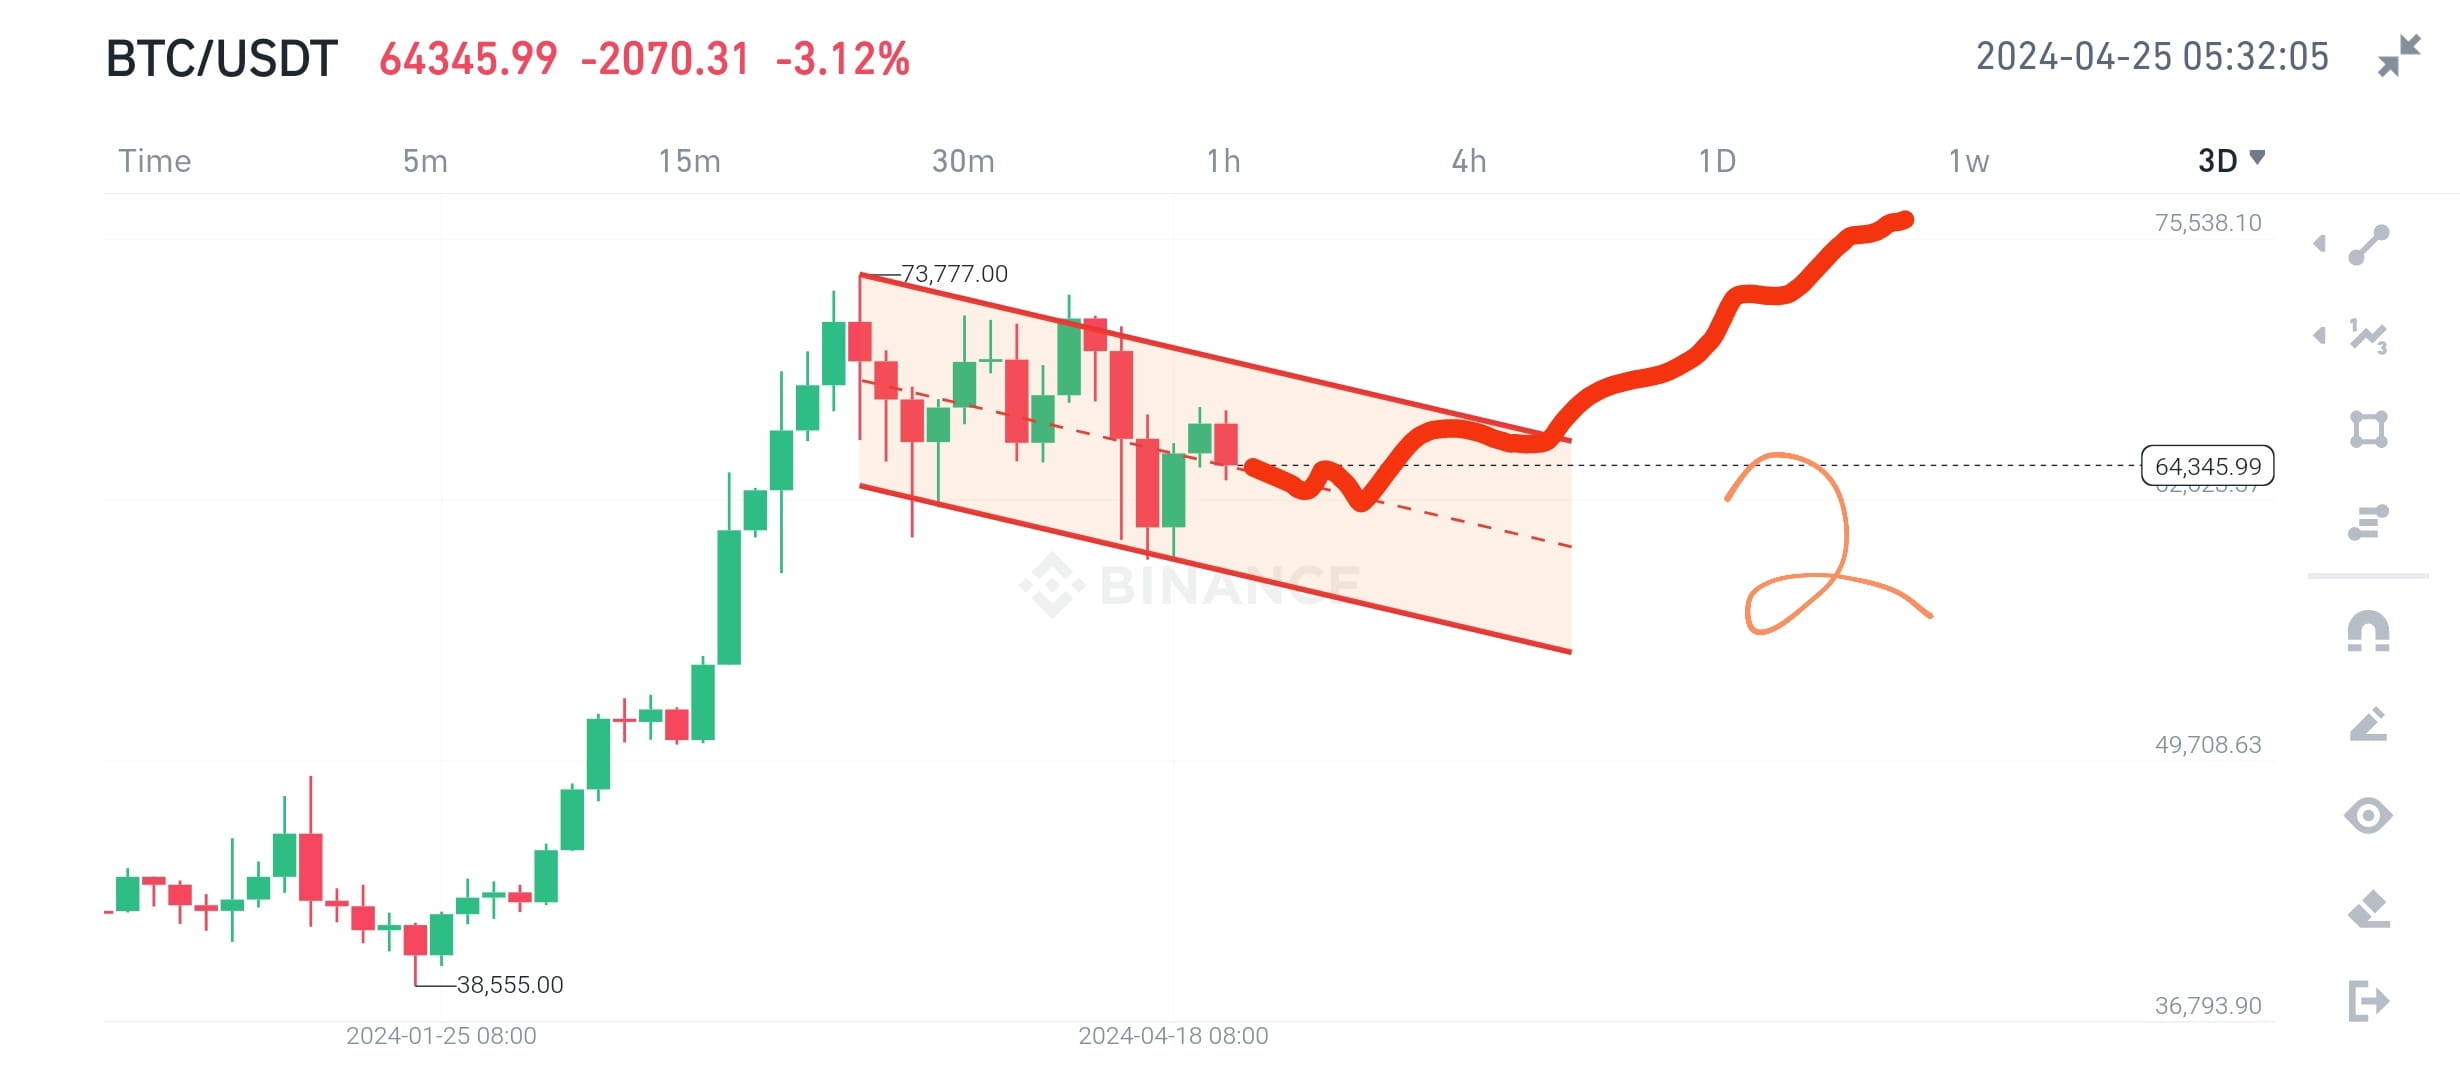
✅ Figure-2 chart displays that if $BTC remains within channel and it is highly possible it will rebound from support of the channel and breaks the resistance of the descending channel and price continue to rise upward.
Also in case, if Bitcoin is unable to hold support of the lower channel the analysis will be invalid then.
Other key indicators are as follows on a 3D chart.
✅ Bitcoin price is currently moving between MA(7) and MA(25). Where MA(7) is working as resistance and MA(25) exactly as support.
✅Price lower than EMA(7) and much higher than EMA(25). Dump towards MA(25) possible which is around the support zone of the descending channel.
✅Bollinger Band(21,2): UP: 74,018
MB or 20-SMA: 66,238
DN: 58,459 Price is moving lower than 20-SMA. Indicating downword or bearish trend.
✅Volume is decreasing as MA(5) and MA(10) on volume near crossing. This is usually a Bullish trend signal.
✅MACD: -1318 showing bearish trend.
✅ RSI: 45.04 in a neutral zone.
✅Stochastic greater than MastochRSI. This is a bullish indication.
✅AVL less than current price. Bearish indication.
📝PLEASE PRESS FOLLOW if you agree and like the idea and also want more information about other crypto currencies. DYOR for financial activities. This information is only for learning and education purposes. Thank you.