原文参照
🔥💰💰🔥$FTM 最新データからの更新と価格分析。🔥🔥💰🔥
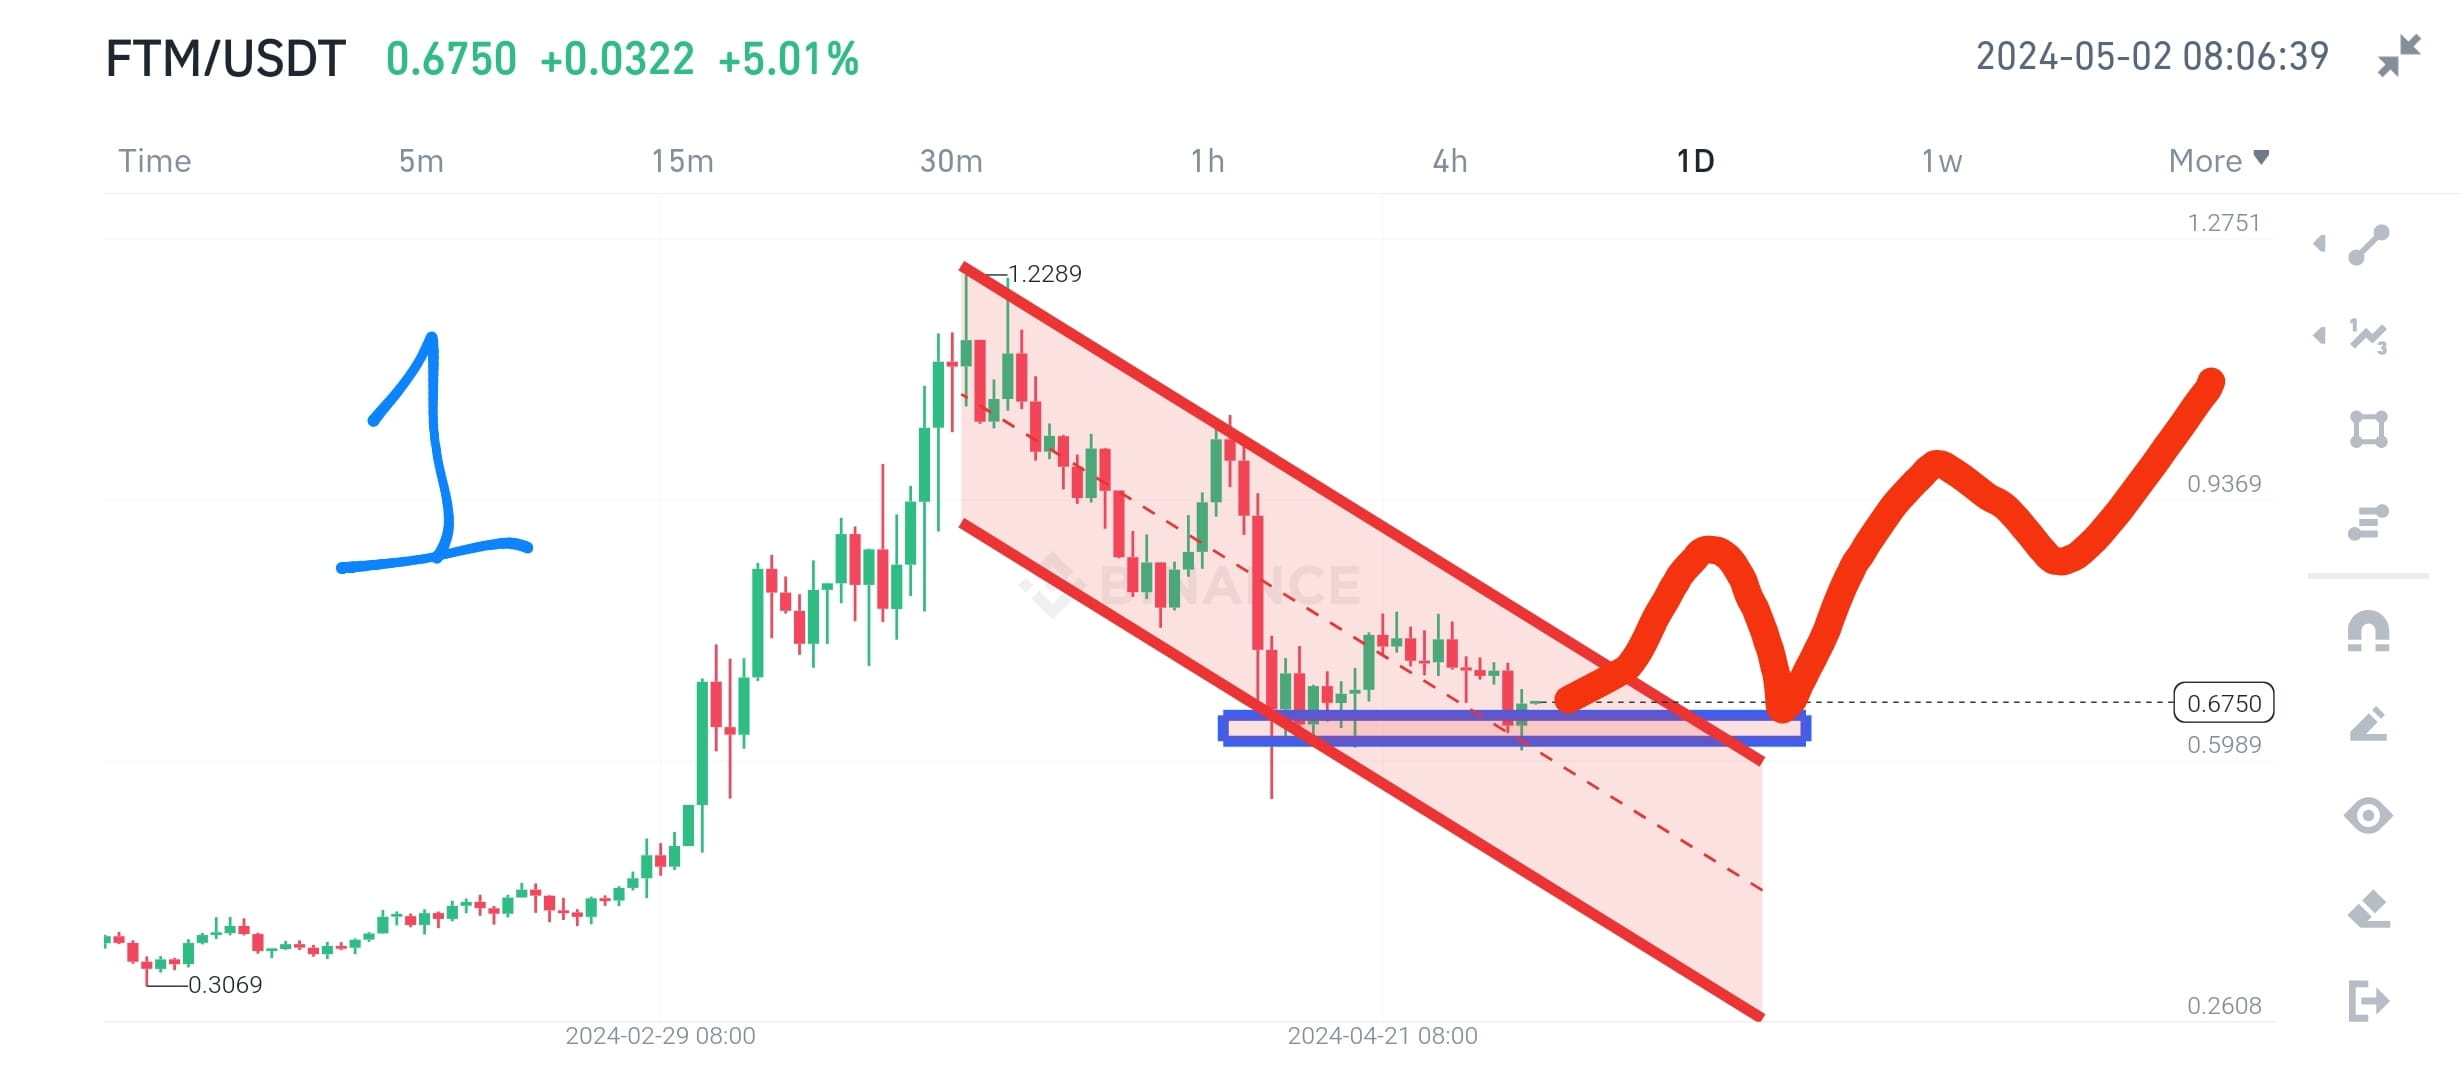
✅🔥図 1 は#FTMの現在の状態を表しています。下降チャネルでまだ動いており、現在非常に重要なサポート ゾーンにあることがわかります。昨日、市場が暴落/暴落/修正/下落したとき、FTM 価格も下落しましたが、サポート ゾーンから反発しました。以前の投稿ですでに分析を行っており、現在のサポート ゾーンを維持することが非常に重要であると述べられています。詳細については、その投稿をご覧ください。リンクは下にあります。
https://www.binance.com/square/post/7098220678665?ref=60984690&utm_campaign=app_square_share_link&utm_source=copyLink
インジケーターは$FTM に影響します。
✅🚨 MA、EMA、ボリンジャーバンドなどのインジケーターは現在弱気トレンドを示しています。
✅🚨RSIなどのインジケーターは中立ゾーンにあります
✅🚨ボリュームの増加やMACDなどのインジケーターは低い範囲内で変化しています。
📢🔥全体的に、市場センチメントは恐怖/ネガティブです。これは、トレーダーが今後大きな利益を得る良い機会です。
🚨📝同意し、アイデアを気に入って、市場に関する最新情報や情報をさらに知りたい場合は、フォローを押してください。金融活動についてはDYORをご覧ください。ここで共有されるコンテンツは学習と教育目的のみに使用されます
#BullorBear #Memecoins $PEPE #buythedip #BinanceLaunchpool #ScamRiskWarning
免責事項:第三者の意見を含みます。当社による財務上の助言ではありません。スポンサーのコンテンツが含まれる場合があります。 利用規約をご覧ください。
返信 3
暗号資産の最新ニュース総まとめ
⚡️ 暗号資産に関する最新のディスカッションに参加
💬 お気に入りのクリエイターと交流
👍 興味のあるコンテンツがきっと見つかります
メール / 電話番号