🔥💰💰🔥$FTM actualización y análisis de precios a partir de datos recientes.🔥🔥💰🔥
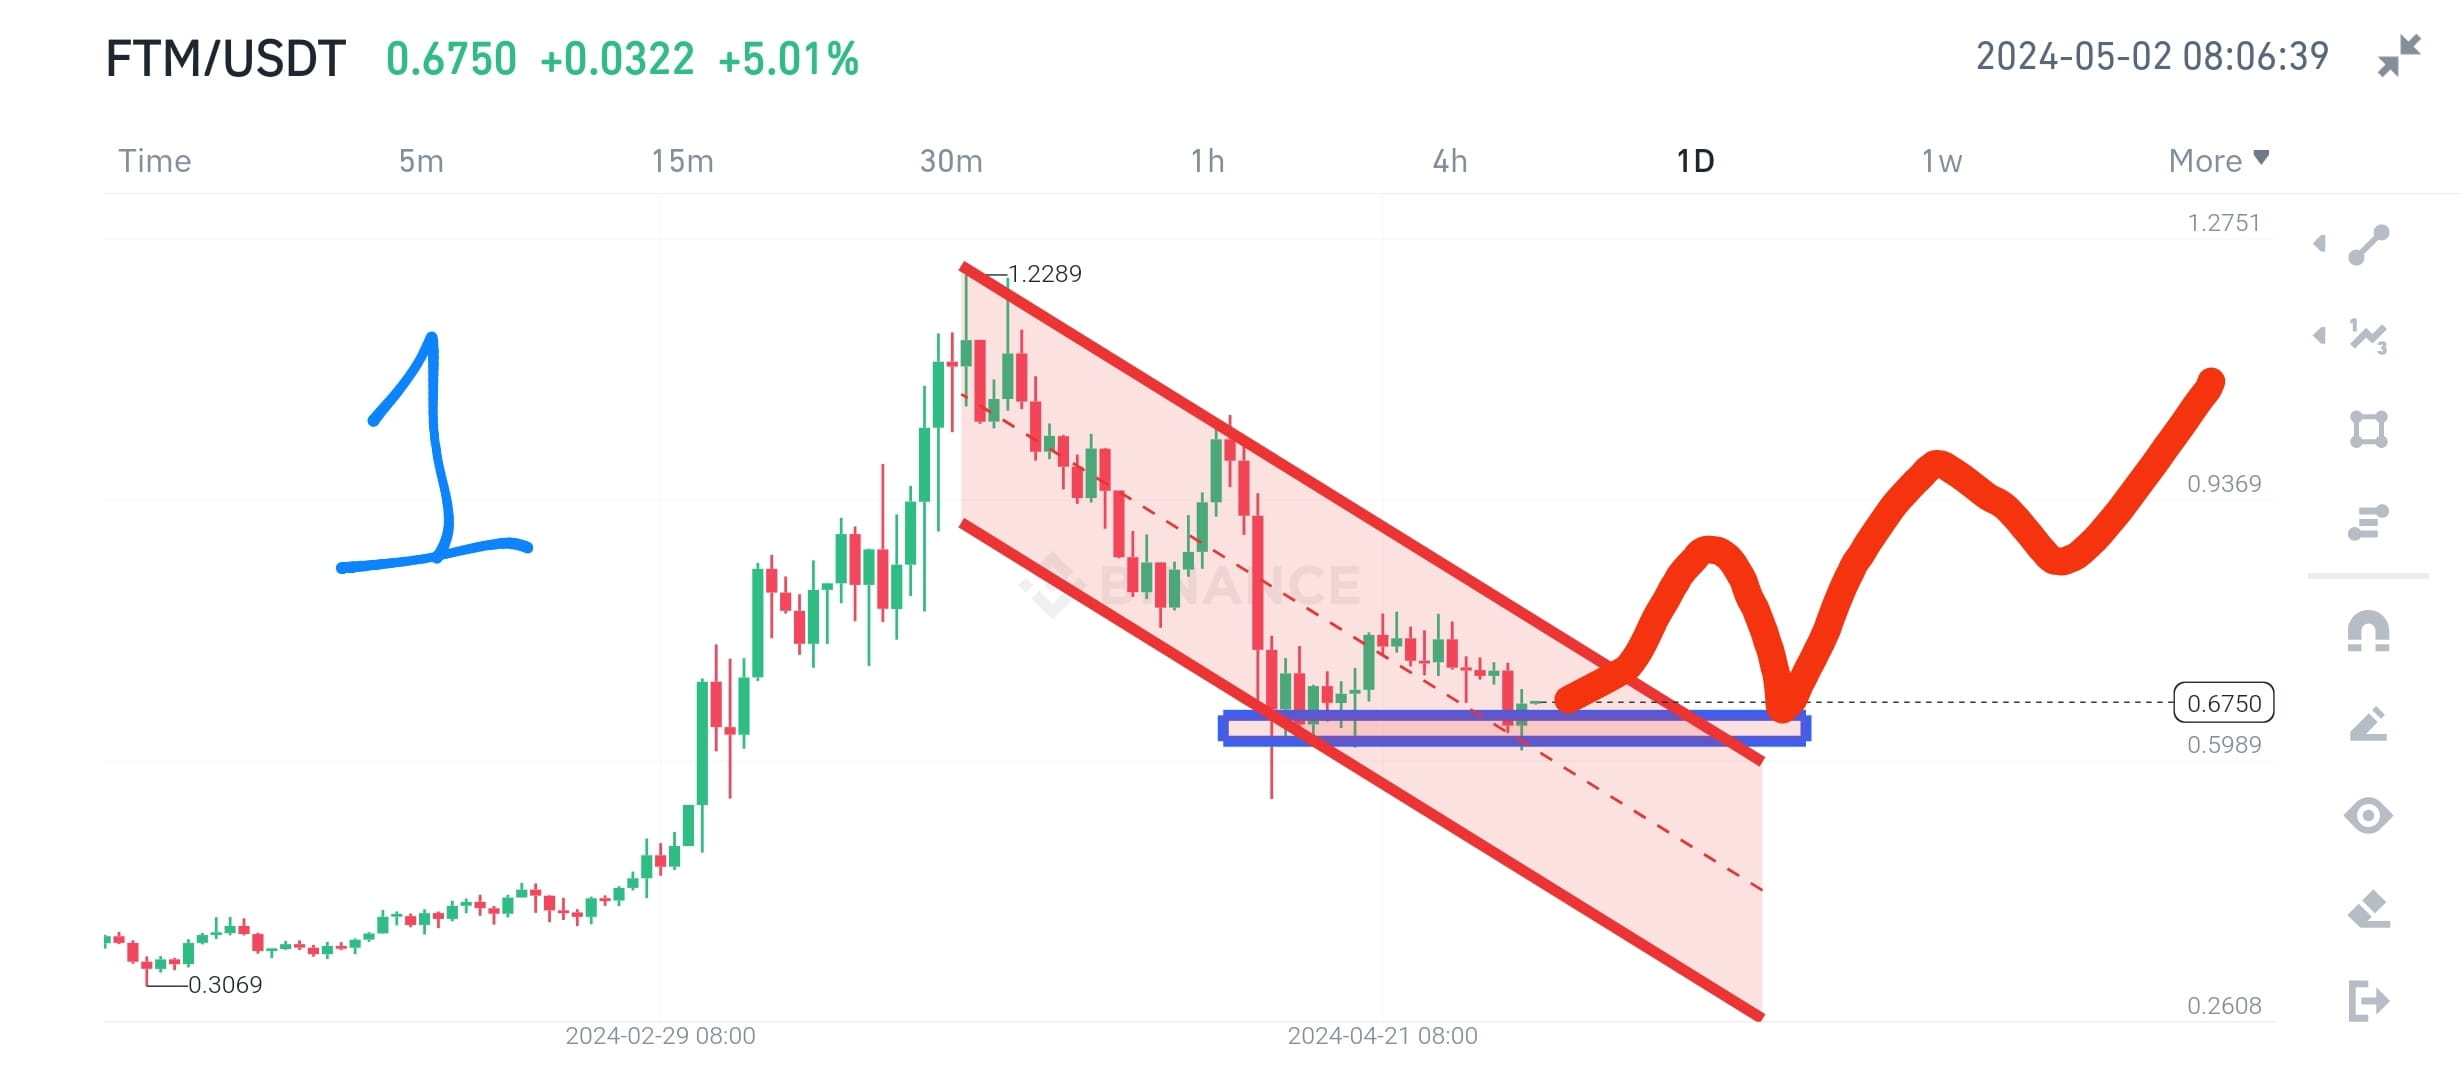
✅🔥La Figura 1 representa el estado actual de #FTM. Se puede ver que todavía se está moviendo en un canal descendente y actualmente se encuentra en una zona de soporte muy importante. Cuando el mercado se desplomó / se desplomó / corrigió / bajó ayer, el precio de FTM también experimentó una caída, pero se recuperó de la zona de soporte. Ya hemos dado un análisis en nuestra publicación anterior, donde mencionamos que es muy importante mantener la zona de soporte actual. Puede visitar esa publicación para obtener más detalles. El enlace está debajo.
https://www.binance.com/square/post/7098220678665?ref=60984690&utm_campaign=app_square_share_link&utm_source=copyLink
Efecto de los indicadores en $FTM .
✅🚨 Indicadores como MA, EMA y Bollinger Band actualmente muestran una tendencia bajista.
✅🚨Indicador como RSI está en zona neutral
✅ 🚨Indicadores como el aumento del volumen y el cambio del MACD dentro del rango inferior.
📢🔥En general, los sentimientos del mercado son de miedo/negativos. Lo cual es una buena oportunidad para que los operadores obtengan buenas ganancias en el futuro.
🚨📝Presione seguir si está de acuerdo, si le gusta la idea y para obtener más actualizaciones e información sobre el mercado. DYOR para actividades financieras. El contenido compartido aquí es sólo para fines educativos y de aprendizaje.
#BullorBear #Memecoins $PEPE #buythedip #BinanceLaunchpool #ScamRiskWarning