🔥🔥🚀$RNDR análisis de precios según datos actuales del mercado. 🚀
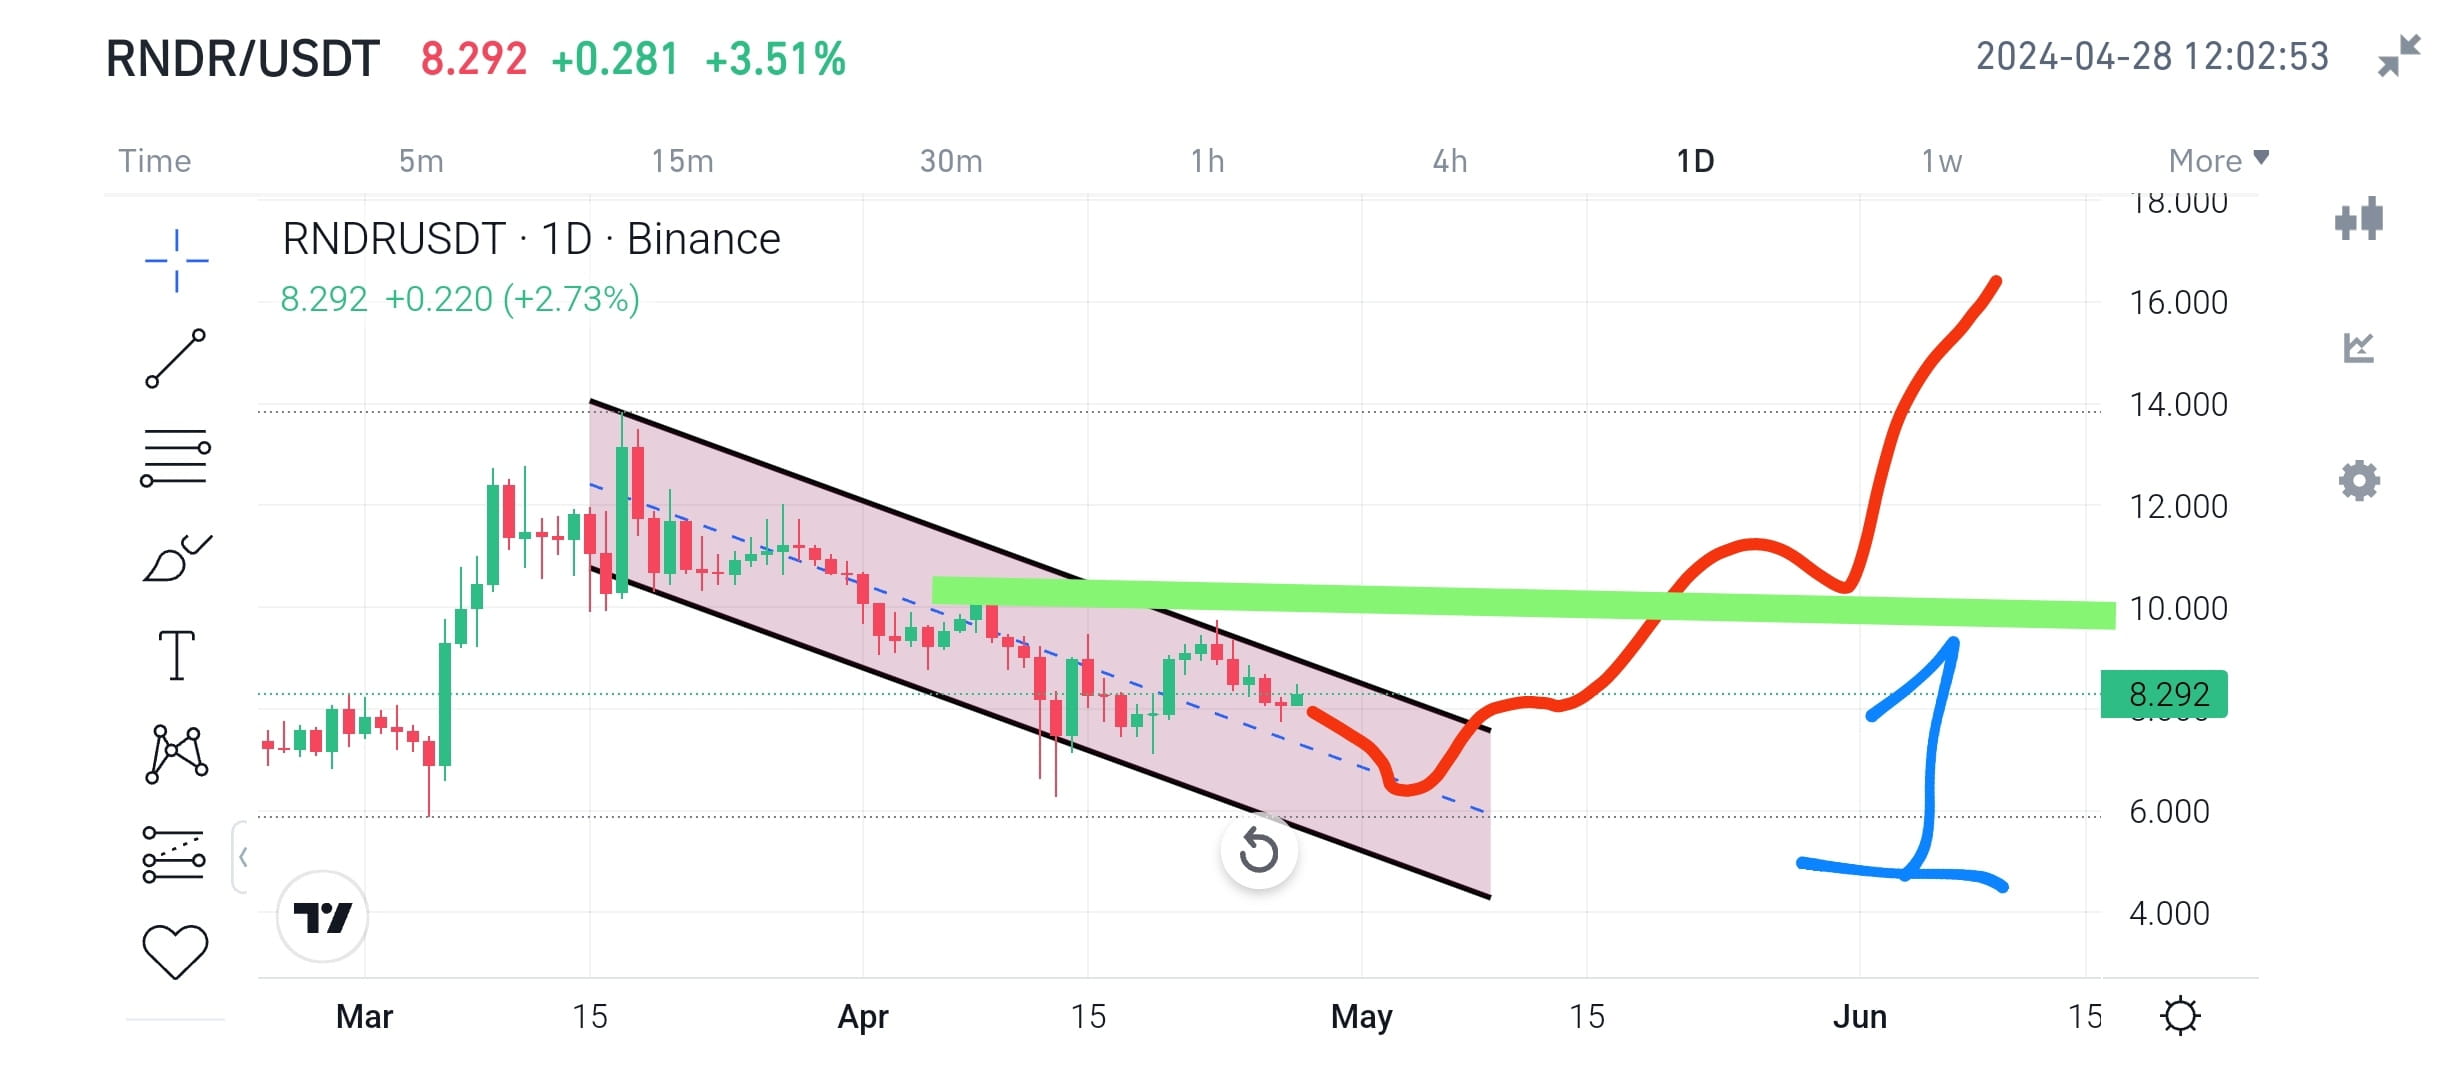
✅🔥 La Figura 1 muestra que #RNDR/USDT💥 se está consolidando entre la parte central y superior del canal, es decir, uno actúa como soporte (línea de tendencia central) y el otro como resistencia (línea de tendencia superior) del canal descendente. Es posible que vuelva a probar la zona de soporte unas cuantas veces más desde donde es muy probable que los precios reboten y después de lo cual el precio posiblemente continúe moviéndose hacia arriba con un rango de $15-16. RNDR está mostrando un buen movimiento y ya ha subido entre un 50% y un 70% con respecto al reciente vertido.
✅🔥 El gráfico de la Figura 2 muestra que si Render no logra romper la resistencia del canal descendente, entonces el precio puede caer con fuerza y probablemente tocar el fondo del canal, pero es posible que $RNDR rebote desde el soporte inferior del canal. El rebote desde el soporte será fuerte como el último movimiento y continuará moviéndose hacia arriba y posiblemente rompa la resistencia superior del canal descendente. Este es un argumento bastante sólido a favor del movimiento alcista y la dirección futura de los precios.
✅🔥 Compradores al contado, si compraron a un precio más alto, esperen a que $RNDR pase por la zona inferior del canal descendente y luego podrán hacer DCA y HODL para obtener una buena recompensa. Una observación del desempeño de los precios, las actividades recientes y la capitalización de mercado sugiere que es posible que aumente entre 5 y 7 veces durante el próximo tramo del mercado alcista. Por lo tanto, mantenga la calma y comprenda la situación reciente del mercado. Las monedas de IA son el líder del encierro esta temporada.
📝PULSE SEGUIR si te gusta y estás de acuerdo con la idea y quieres más información sobre otras criptomonedas. DYOR para actividades financieras. Esta información es sólo para fines de aprendizaje y educación. Gracias.