
Carefully! Lots of text.
TradingView is an in-browser platform for charting and monitoring cryptocurrencies and other financial assets. Its charting tools are also available for use directly within the Binance trading interface. In addition to charting, you can share your trading strategies and broadcast your analysis in real time.
When it comes to free options, TradingView is a powerful tool for traders of all experience levels. The basic functions should be enough for most of them. However, be careful when exploring other users' ideas and broadcasts. It is important not to blindly follow someone, but to find information that will add value to your own strategy.
Introduction
Traders who prefer technical analysis need reliable charting tools. TradingView caters to the needs of both beginners and experienced participants. It offers a variety of trading and charting tools, with some platform functionality available for free. Let's face it... Not everyone has the means or need to subscribe to Bloomberg Terminal.
If you have traded on Binance, you may have already noticed the TradingView tools available. However, without sufficient understanding, they can only scare away. There are many options, but where to start? To better understand TradingView's capabilities, check out our beginner's guide.
Do you want to put the acquired knowledge into practice?

What is the TradingView platform for?
TradingView is a platform that allows you to customize technical indicators, create charts, and analyze financial assets. These indicators are patterns, lines and shapes that millions of traders use every day. TradingView is available in the browser and does not require a client download. If you prefer to trade from mobile devices, you can download apps for iOS and Android.
TradingView was launched in Westerville, Ohio in 2011 and today has a huge user base, with eight million accounts created in 2020 alone. Users can chart and analyze a variety of stocks, commodities, and cryptocurrencies such as Bitcoin with a free or premium account. You can share the created strategies and templates in the community. This way, you have the opportunity to improve your skills based on feedback from other TradingView users.
TradingView на Binance
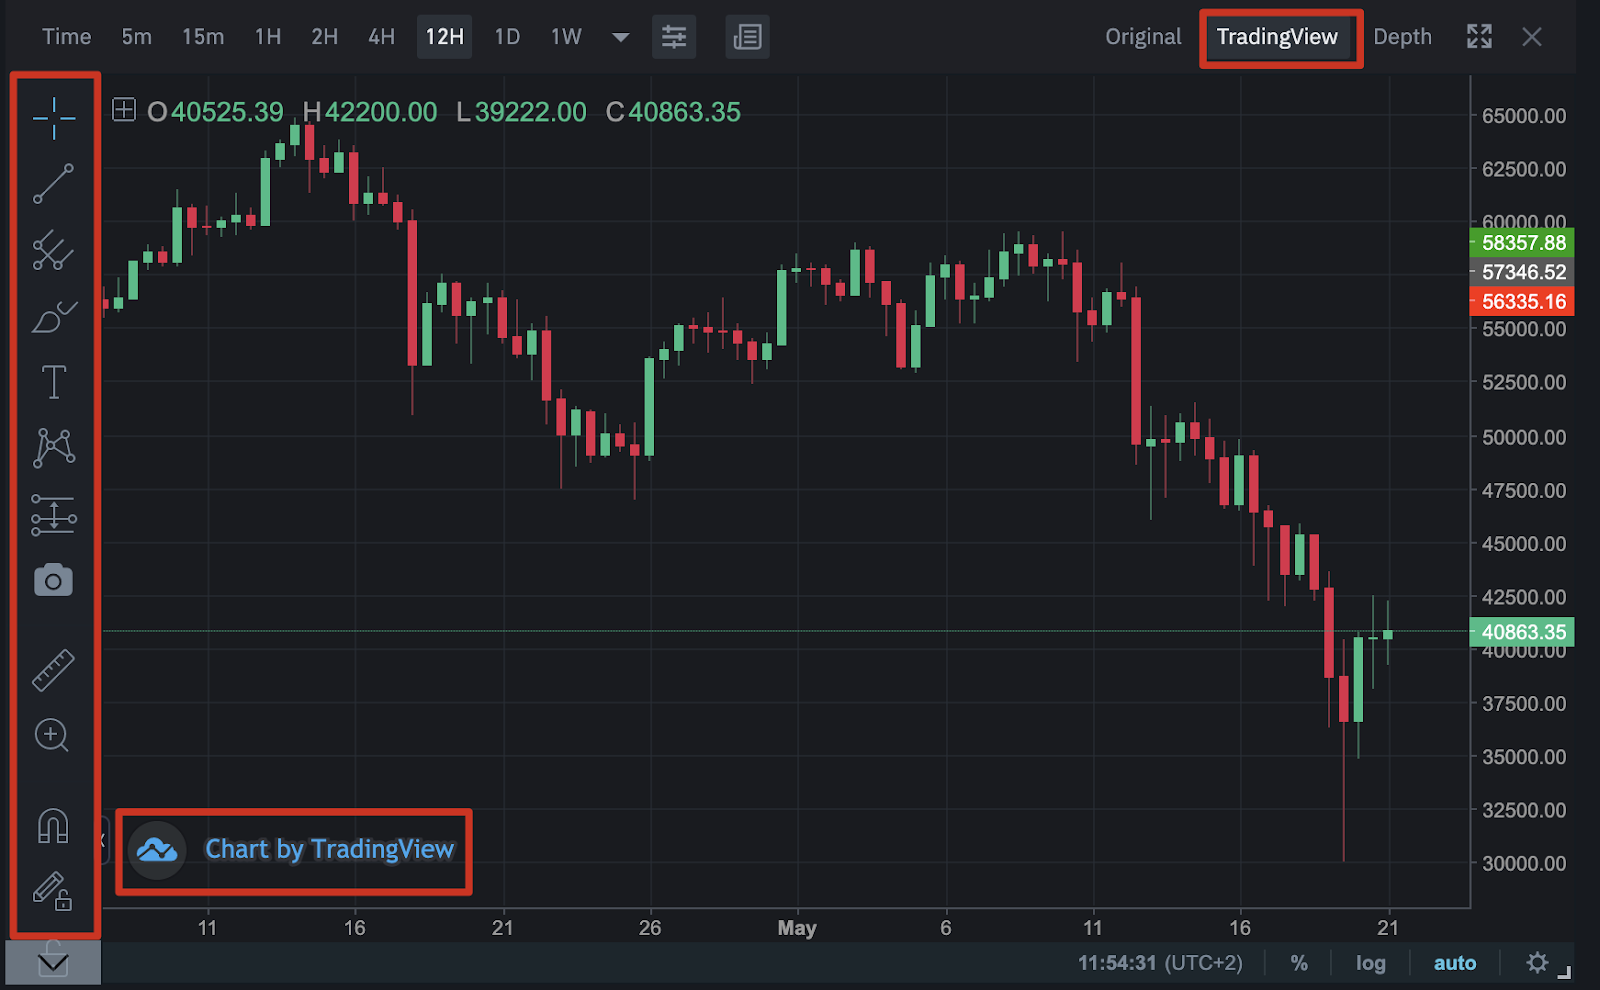
Binance has TradingView tools built into the interface so users can create charts and trade at the same time. The tools on the left are only a small part of all available, but they have the same functionality as on the TradingView website.
To quickly familiarize yourself with the interface, read our article on How to Use Binance Web TradingView.
How much does it cost to use TradingView?
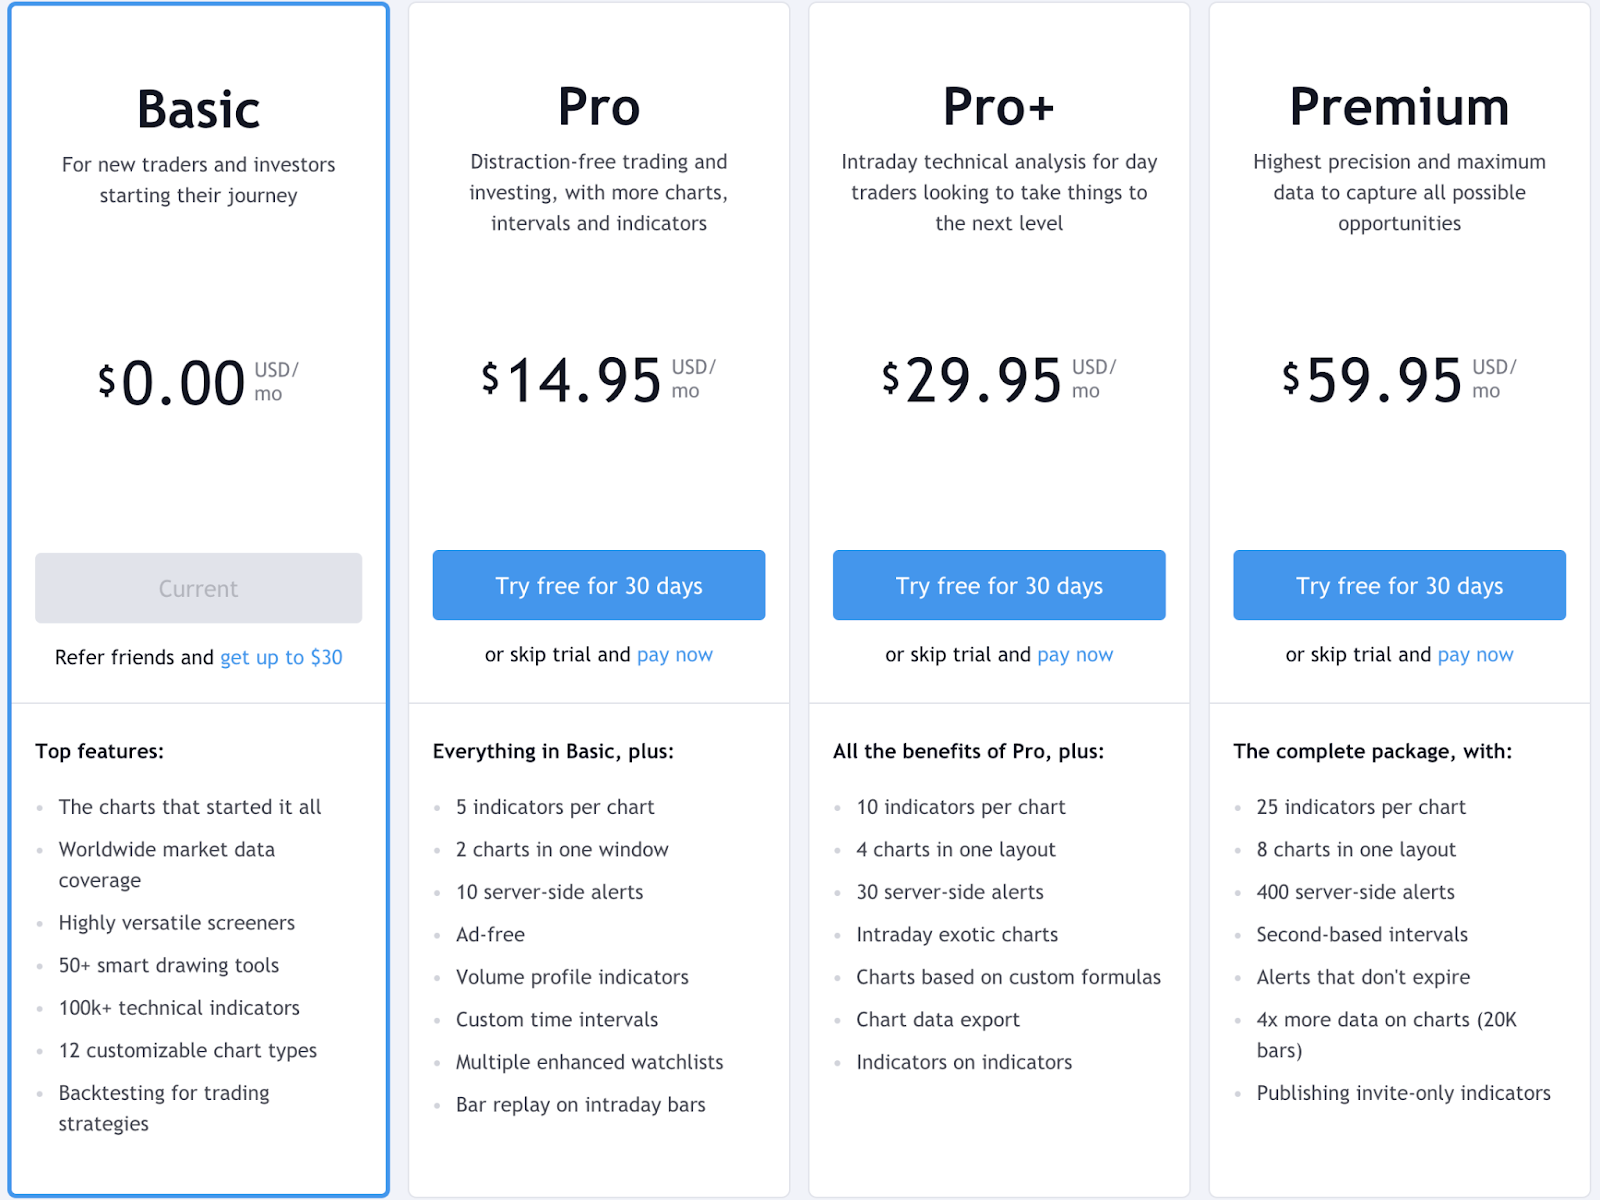
As we have already said, TradingView is a free tool for everyone. However, there are also premium subscriptions that increase the number of indicators and charts available for viewing at the same time. For beginners, a free account with one chart and three indicators is suitable. You'll also have to put up with ads, but they won't be too intrusive. Below you can learn more about the different subscription options:
TradingView is a social network?
TradingView provides Instagram-like features for sharing opinions and showcasing trading strategies. On the Ideas and Broadcasts pages you can get advice or feedback. Specifically, on the Ideas page, you'll see charts, videos, and comments from other users. Community members can also participate in discussions and chats. But remember that every user can create and share their own ideas, so be careful. Each trader has his own style and strategy, so do not take their publications as financial advice.
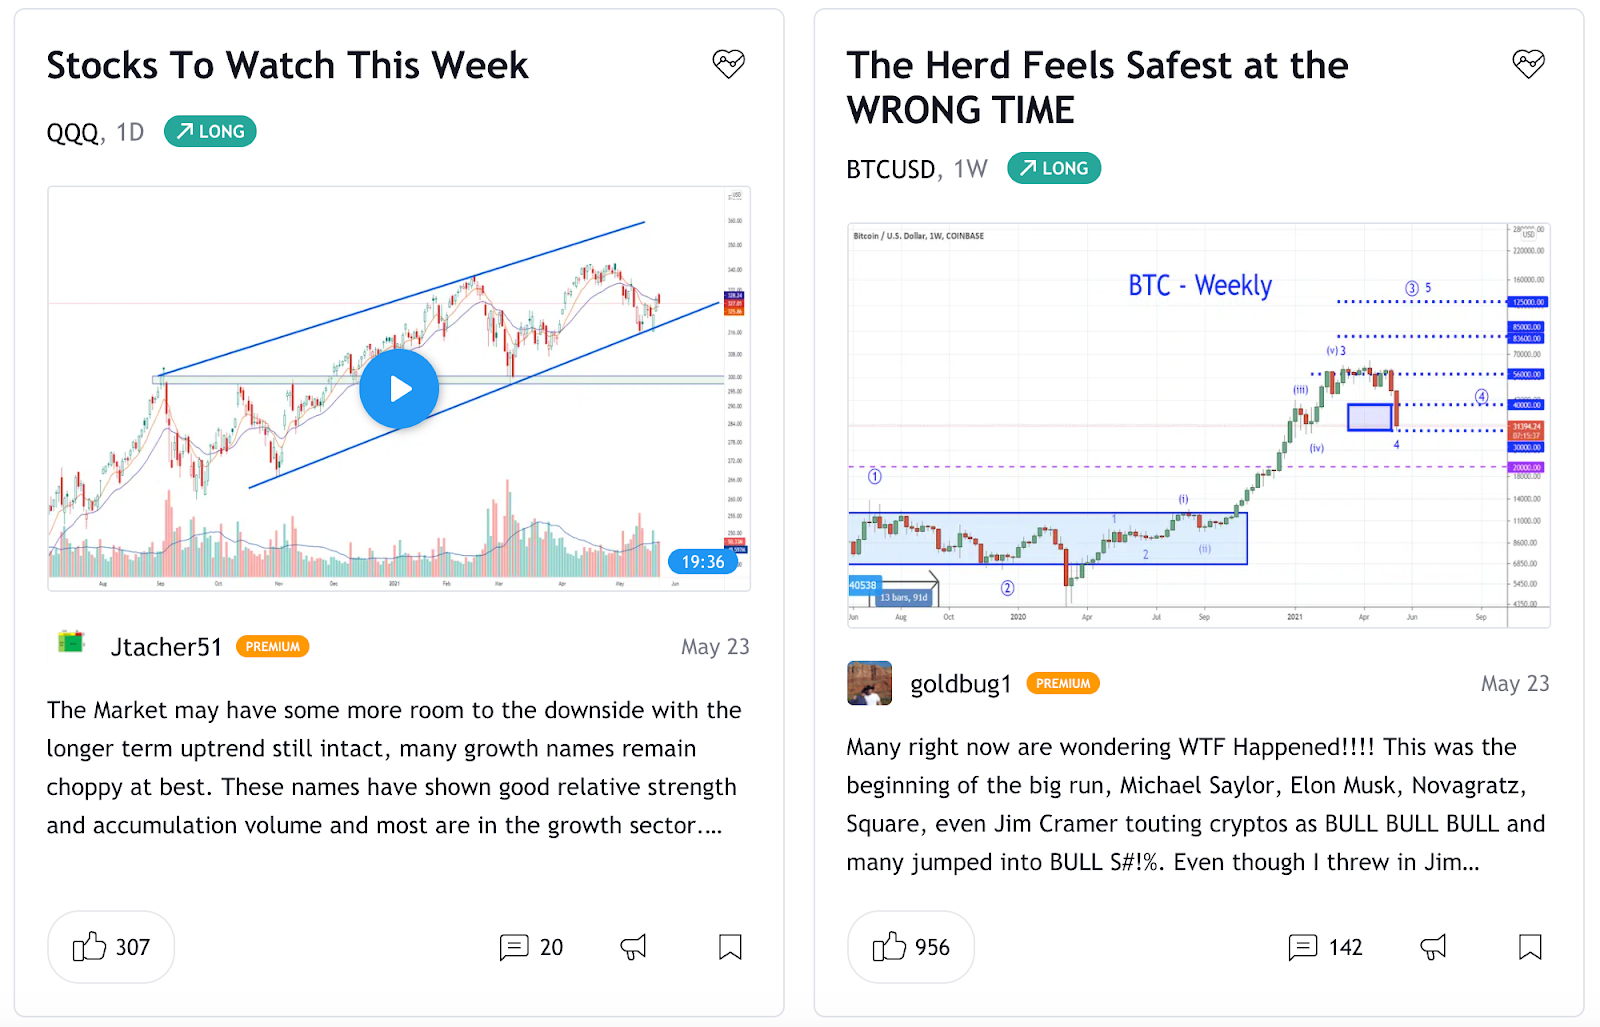
Plus, similar to your favorite player's Twitch stream, TradingView broadcasts allow you to watch other traders create charts in real time. This additional feature is still in beta and the amount of content is relatively small.
TradingView interface
If you've never used charting tools before, the TradingView interface may seem a little confusing. Let's figure it out.
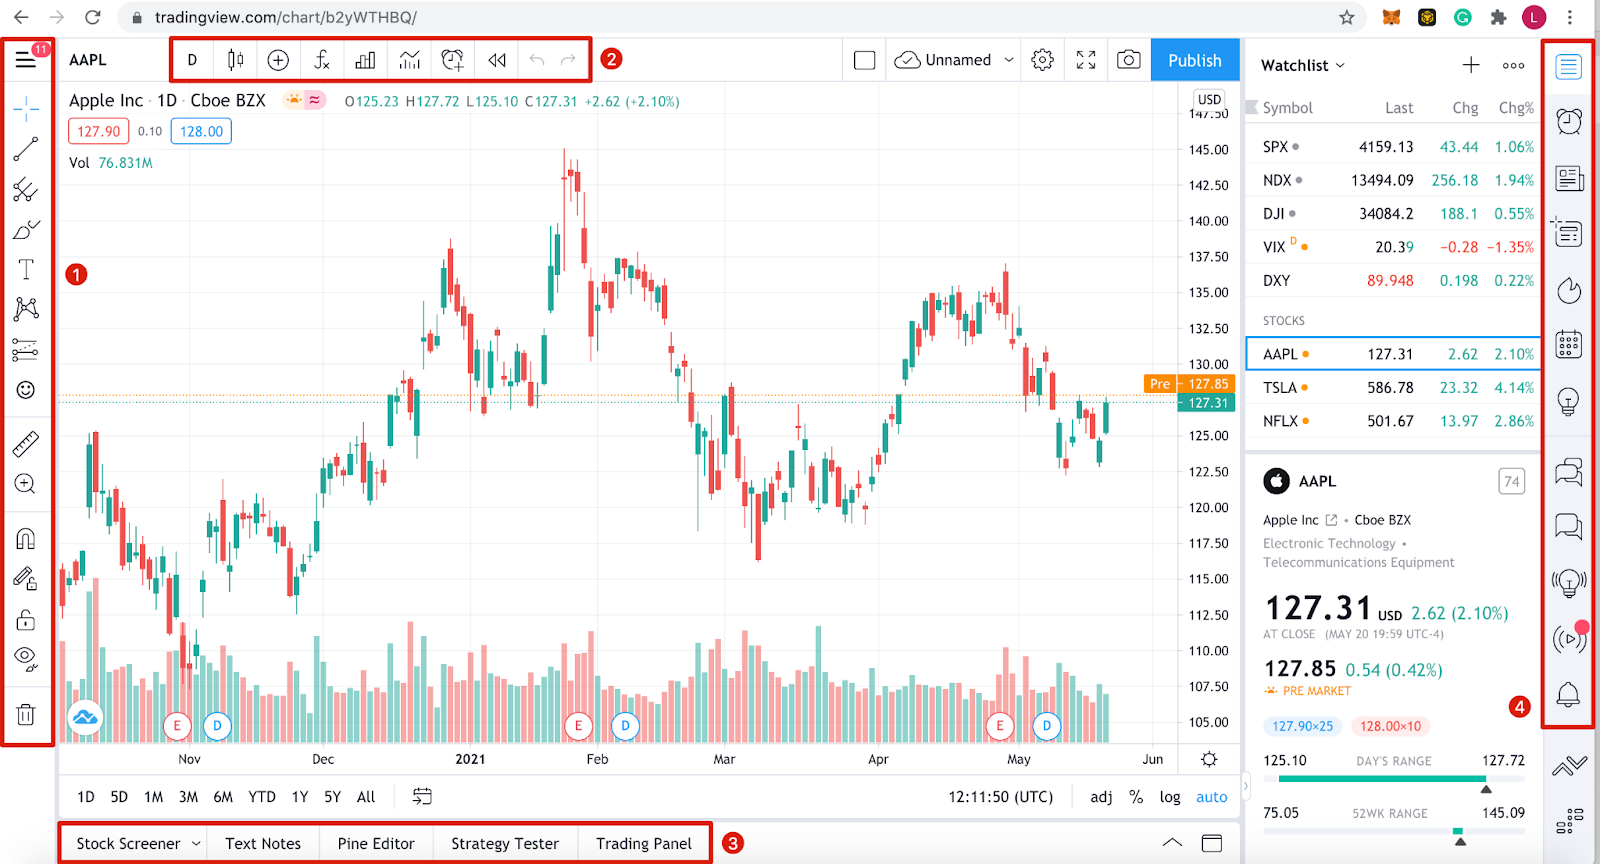
Toolbar 1
This toolbar contains all the charting and drawing tools that you can use directly in the chart area. From simple lines to long and short positions, there is a lot to explore. To access an expanded selection, right-click on each tool. Some are more complex than others, but the standard set contains enough basic tools to get you started.
Toolbar 2
Here are the chart display settings. You can choose between candlesticks, line charts, area charts, etc. There is also a search bar on the left where you can change the asset displayed. Another tool worth paying attention to is the [Indicators and Strategies] button for inserting pre-made analysis templates, such as the moving average.
Toolbar 3
TradingView does not offer brokerage services, but you can trade on the site using the [Trading Panel] tab. There you will find a list of partners with whom you can make transactions if you already have an open account. Additionally, you can test your strategies using the [Strategy Tester] feature.
Toolbar 4
This block includes news and social elements of TradingView. You can set up a list of traders to watch, send private messages to other users, explore ideas and broadcasts, and access a personalized calendar. If you need to find any data, lists or information, search this section.
Graph area
When you change the asset you're viewing, use any tools, or place indicators, they appear in the main chart area. You can customize almost everything you see. We'll talk about this in the next section.
Ready to try trading on a crypto exchange?
Personalizing TradingView Charts
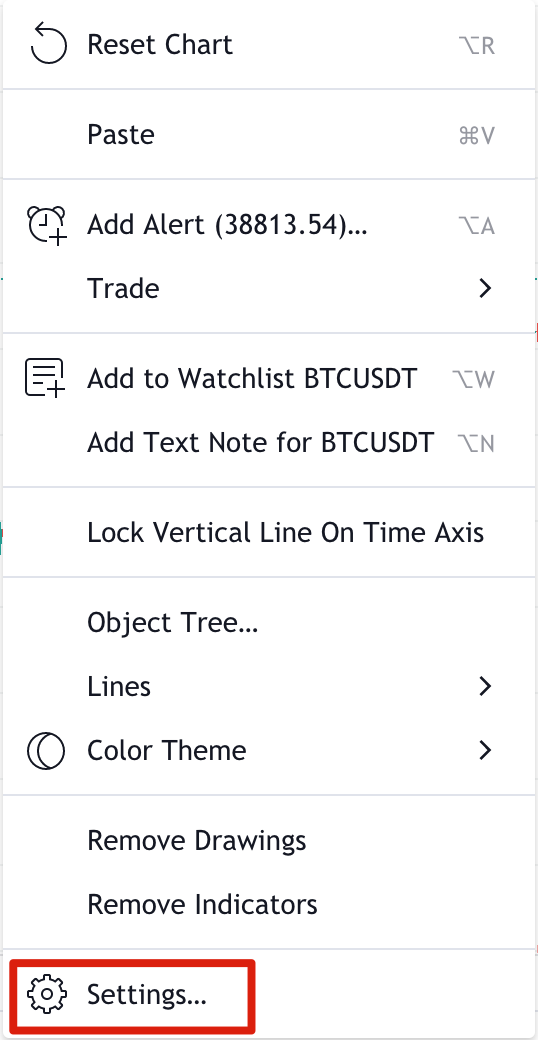
When it comes to displaying graphs, everyone has their own preferences. Customizing colors, lines, and axes makes your graphs easier to read and understand. You can find all the necessary settings by right-clicking in the graph area and selecting [Settings...].
In the [Settings...] menu, you can also reset the chart if it has become too confusing and set up email alerts for price levels.
After selecting [Settings...], you will be taken to the [Chart Settings] window, where you can change the range of parameters. Let's go through the main ones.
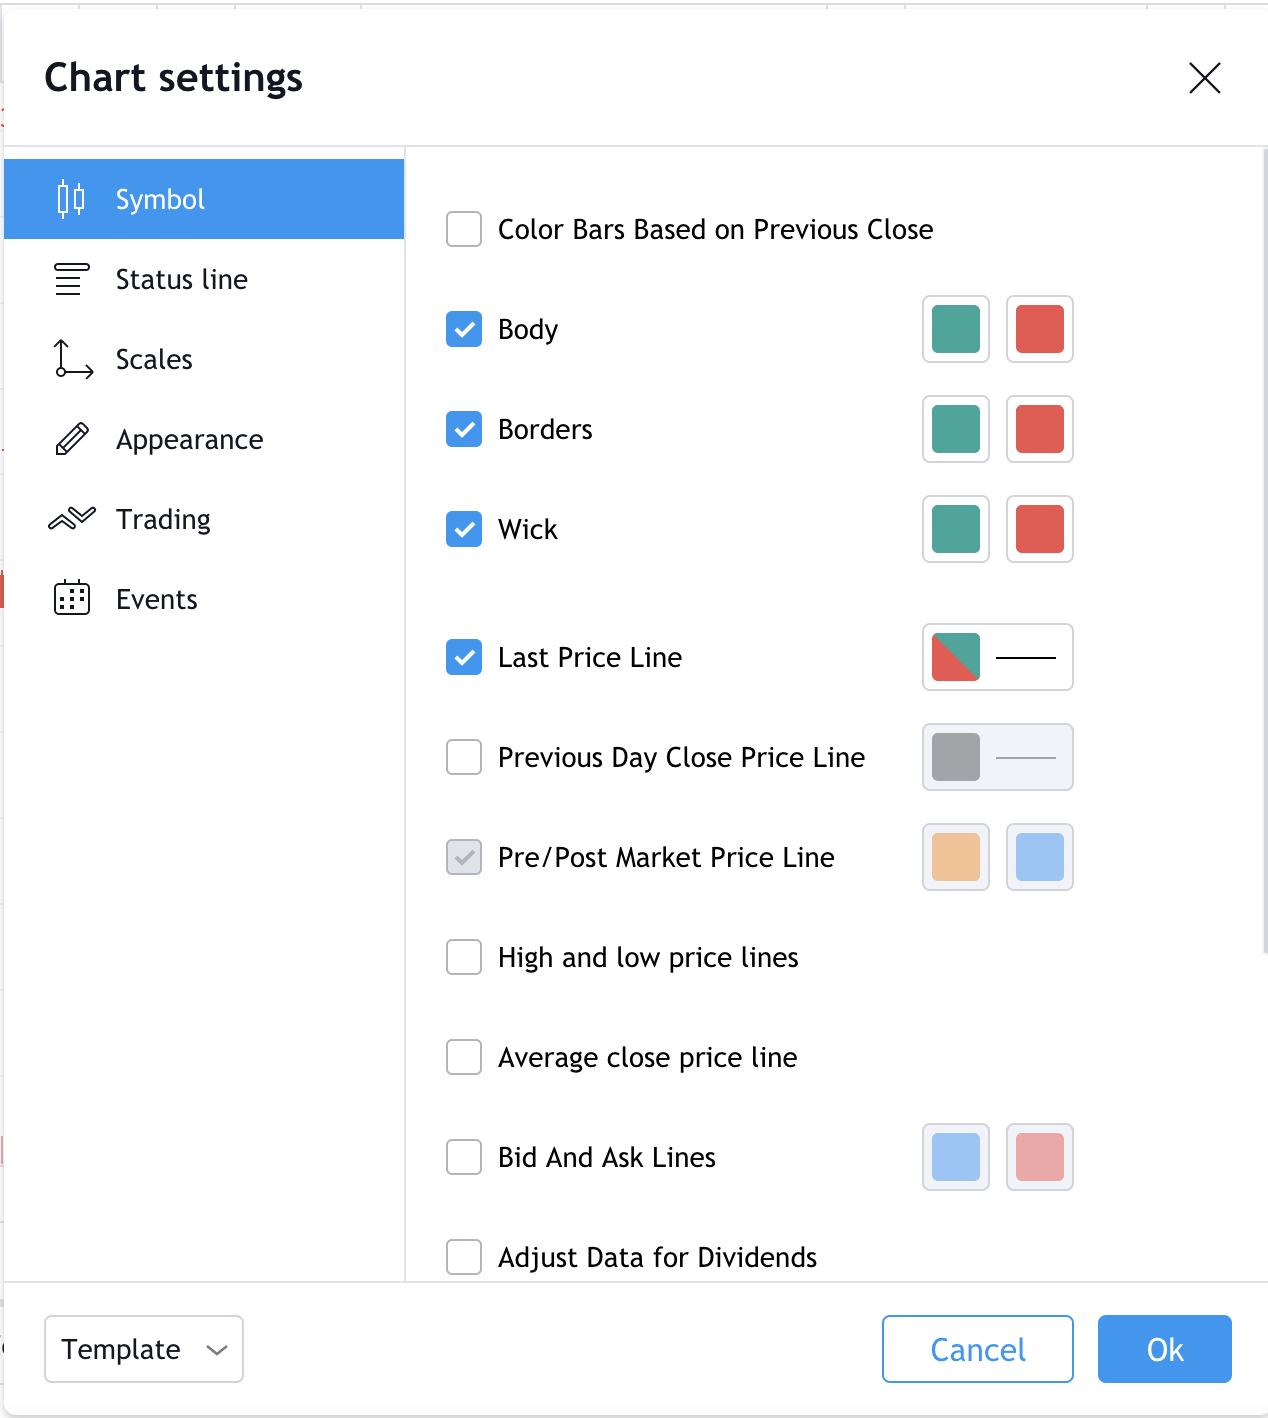
1. The [Tool] tab allows you to change the appearance of candlestick charts. Each part of the candle pattern can be labeled with a color that you like.
2. The [Status Bar] tab contains options for changing the information located in the upper left corner of the chart, including OHLC (Open, High, Low and Close) data, buy and sell buttons. The red field shows the minimum bid price (38,345.96), the blue field shows the highest bid price (38,345.97). So the bid-ask spread is (0.01).

3. The [Scales] tab contains options for changing the trackers on the right axis. For example, you can add daily high and low prices or a countdown to the bar's close.
4. The [Appearance] tab allows you to change grid lines, background color, axes, and other graphic elements.
5. The [Trade] tab allows you to customize visual elements if you are logged into your broker account.
6. The [Events] tab contains settings for dividends, splits and other events in the chart area.
Along with customizing the chart design, you can also change the intervals of candles and other symbols. To do this, go to the top panel and click the leftmost button. A long list of intervals will be displayed, ranging from seconds to months. You can add several intervals to your favorites, and they will be displayed in the top bar.
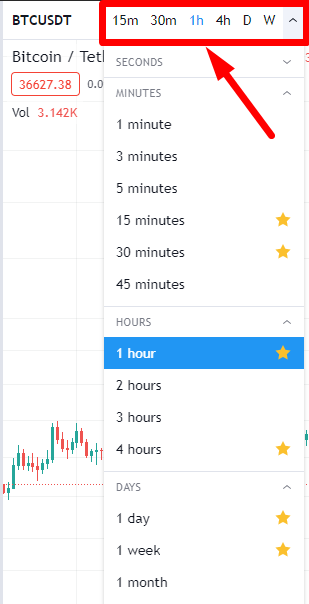
There is no need for manual saving while setting up the schedule. TradingView saves all your settings in real time, so you can log out of your account and return to them later.
Drawing trend lines
Even if this is your first chart, you can't go wrong with a trendline. It is a beginner-friendly way to model price movement and is one of the most commonly used chart patterns for day and swing trading.
1. To start learning, select the Line tool from the left toolbar.
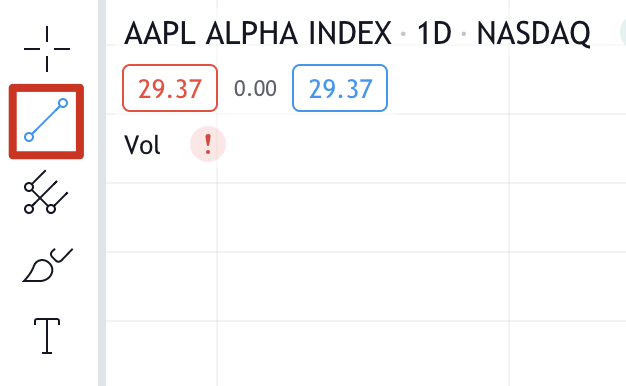
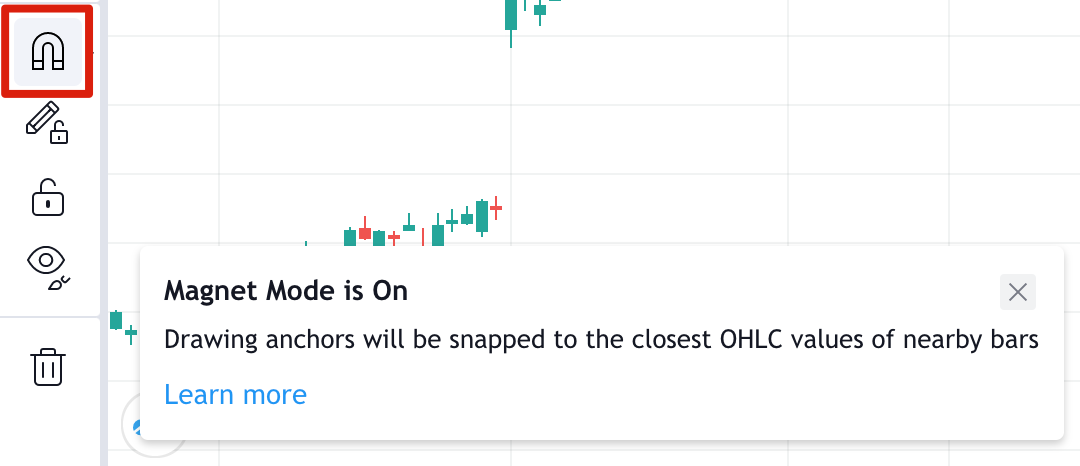
2. You may also like magnet mode. This will snap your lines to the nearest OHLC points for greater accuracy.
3. For a downtrend before a price drop known as a swing high, start the line at the local high (point 1). Click at the desired line start location and try to draw the line through as many maxima as possible. To complete the line, click on the chart again.
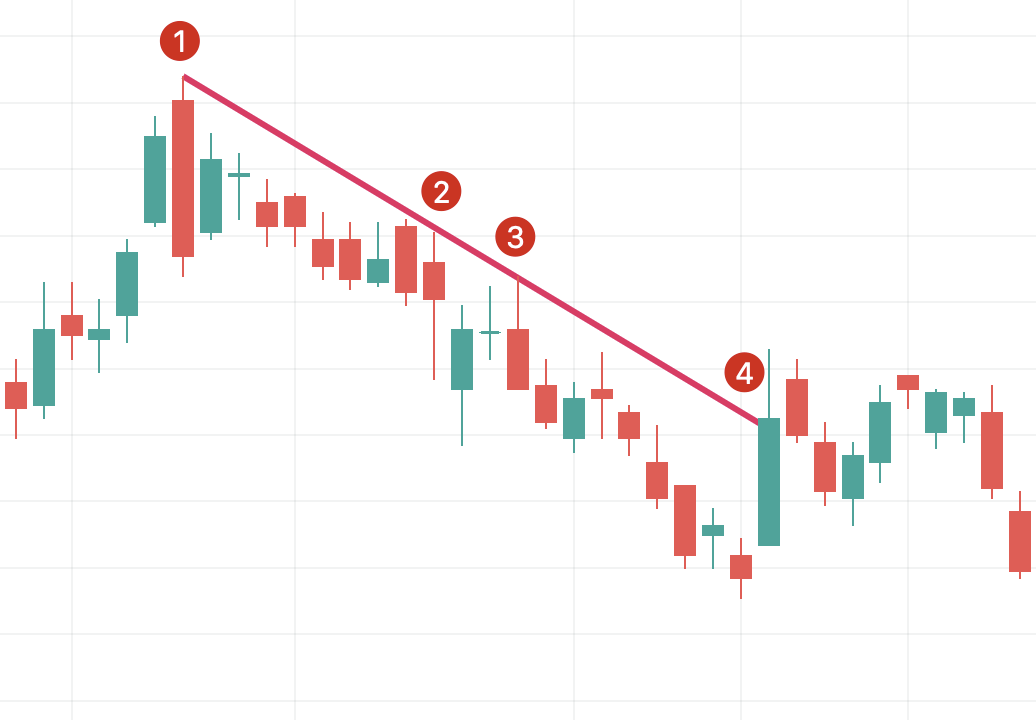
Points 1, 2 and 3 are resistance points. It is always better to have at least three points testing the trend line, since two may be random. Point 4 shows a trend break: from this point it is best to draw a new trend line.
If you are observing a downtrend, one possible strategy is to sell when the price tests your line. If you decide to display an uptrend, make sure you start the line at a low price so that the line is below your candle.
For more information on trend lines, read the article Support and Resistance Line Basics.
Drawing a pitchfork
Pitchfork is a more advanced chart that develops the idea of trend lines. This technical indicator was created by Alan Andrews, a famous American investor and educator of the 20th century. This chart is easy to draw and provides more information than just a trend line, so let's take it step by step.
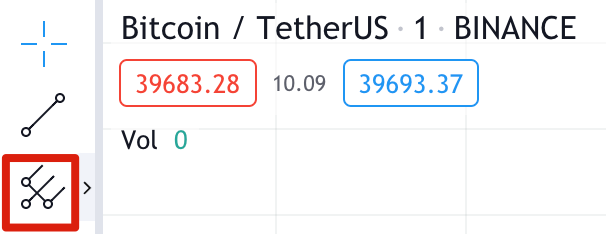
1. To begin, select the “Pitchfork” tool - it is located under the “Line” tool.
2. We will draw a pitchfork by selecting three points at the beginning and end of the trends.
3. In the example below, you can see that we started at point 1 - the low of the downward swing trend. We then select point 2, the swing high of the uptrend swing, and then point 3, the low of the next downtrend.
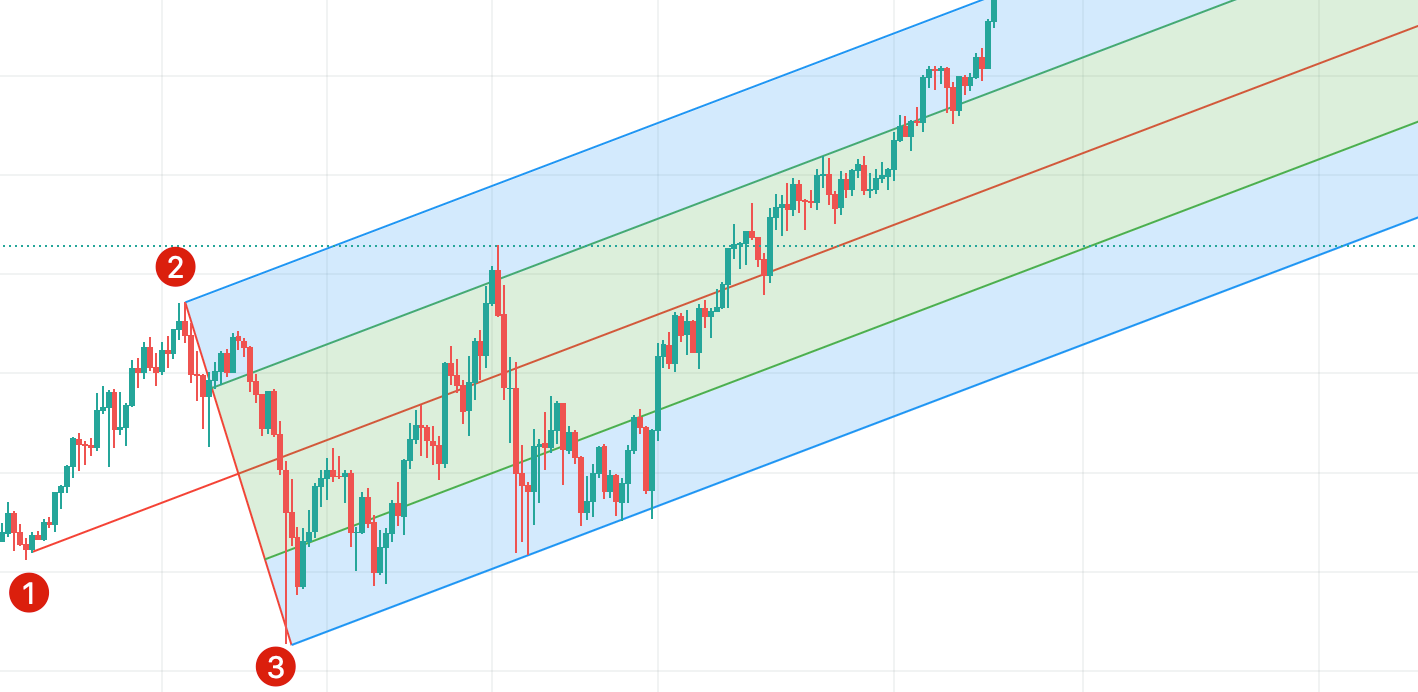
4. These points form a pitchfork pattern, with the upper line coming from point 2 showing the resistance level, and the lower line coming from point 3 showing the support level. The middle line is the expected value to which the price will tend.
5. As in the example with a trend line, the support line shows possible buying areas, and the resistance line shows possible selling areas. To manage risk, you can place a stop loss just below the lower trend line. Please note: like any other indicator, the pitchforks do not always perform exactly as expected. To reduce risks, it is recommended to use this tool simultaneously with other tools and strategies.
If you're interested in learning more, read our article on How to Use TA Indicators on TradingView.
Advantages and Disadvantages of TradingView
In terms of asset monitoring tools, TradingView is just one of many options. Most offer a similar set of charting and trading tools, but let's look at the basics. Some features are, of course, implemented very well in TradingView, but there is still room for improvement.
Advantages
HTML5 graphics tools. TradingView can run on any device with a browser. There is no need to install any software and you can view your charts anywhere.
Free registration. Anyone can access most of the site's features for free.
Server-side notification system. If you set alerts, TradingView monitors them on its servers. You don't need to open TradingView to receive alerts.
Compatible with Binance. You cannot access Binance from the TradingView website, but you can use TradingView in the Binance trading interface. You can buy and sell cryptocurrency on Binance, creating charts on the fly.
Script. More advanced users can create their own indicators, which will be stored on TradingView servers. This feature works using Pine Script, TradingView's simple custom programming language.
Asset selection. A large number of stocks, securities, commodities and Forex market assets are available for charting. We are not limited to just cryptocurrencies!
Backtest. Once you have developed a strategy, you can easily test it using the built-in function.
Flaws
Community suggestions. While the Broadcasts and Ideas tabs are interesting in design, the quality of the material posted there varies markedly. Many of the tips are quite speculative and not very useful for new users. Trolling sometimes occurs in the comments section as well.
Customer support. It is not uncommon for the TradingView community to report issues with TradingView support. Only customers with a paid subscription can contact technical support; support is not provided for users with a free account.
Integration of brokerage services. There are some brokers and trading platforms integrated into TradingView, but their capabilities are still quite limited.
Cboe BZX data. TradingView US stock prices are not sourced directly from the relevant stock markets. For example, the source of NASDAQ stock prices is the Cboe BZX exchange, where prices may differ slightly from actual prices. Real-time exchange data is available for an additional fee.
Trading can be simple
Summary
TradingView is a great option for those looking for a free solution with a wide range of tools. The platform's educational materials are also free and cover the basics of charting and technical indicators.
However, the social side is not so strong. Chat rooms often give speculative advice that should be avoided. For beginners, the social features of the platform are less useful in terms of being able to distinguish good analytics from bad ones.
However, TradingView is worth a try if only for the graphical tools. In addition, this is also an excellent place to backtest trading strategies. Technical analysis is a deep topic, and this free account will be more than enough to study it.
Disclaimer: This article is intended for educational purposes. This article is not an endorsement or recommendation and the information presented should not be construed as financial advice. All screenshots are taken from the official TradingView website and comply with the Terms of Use.