
In recent weeks, Ethereum has been trending down on shorter timeframes, with bulls struggling to hold the critical $1,900 support area. This has allowed bears to gain dominance. However, price sentiment seems to have changed in recent trading sessions.
On the daily chart, ETH is up 2%. On the weekly chart, positive movements can be observed, although still relatively mild.
Despite the price gains, if Ethereum fails to sustain its price above the immediate trading zone, there is a potential risk of a weakening of bullish momentum. From a technical perspective, the altcoin is tilted towards the bullish side, with buying power evident in recent trading sessions.
Both accumulation and demand played a role in this positive shift. Moreover, Ethereum’s market capitalization has grown, indicating increased demand in the past trading sessions.

As of this writing, ETH is trading at $1,840. It is currently approaching the immediate resistance level of $1,850, which has previously acted as a liquidity pocket.
A move closer to this level could trigger a price decline. However, if the altcoin manages to break above $1,850 and establish a trading position above the subsequent resistance at $1,870, it could signal a longer period of bullish activity.
On the other side, support lies at $1,780, followed by $1,760. A drop into this range could result in further price declines.
ETH saw lower volume in the previous session. However, the fact that it is in the green suggests that buyers are gradually entering the market.
technical analysis

Regarding buyer activity, demand for altcoins has increased after a notable drop over the past 48 hours. The relative strength index (RSI) has climbed above the 60 mark, indicating a recovery in altcoins and showing that buyer participation is outstripping seller activity.
Moreover, the price remains above the 20 Simple Moving Average (SMA), suggesting that buyers are the driving force behind the price momentum in the market.
Another observation is that ETH is still above the 200-point simple moving average (SMA) (green). This suggests that a significant price increase is expected before the bullish momentum fades.
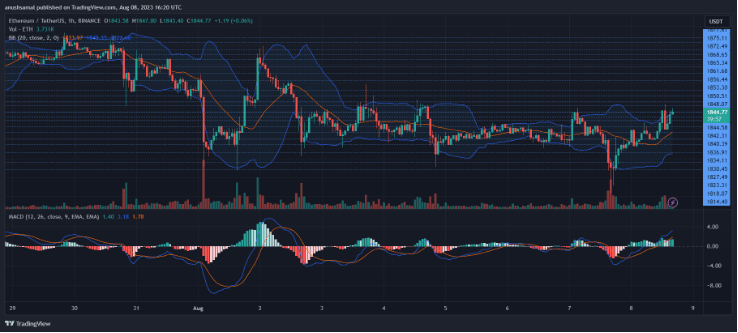
Correlated with the increase in demand, ETH is showing a buy signal on the daily chart. The Moving Average Convergence Divergence (MACD), which indicates price momentum and potential changes, shows a green bar consistent with a buy signal.
These buy signals also indicate a potential increase in prices in the subsequent immediate trading sessions.
Furthermore, the distances between the Bollinger Bands appear to be wide, indicating the possibility of price volatility, although not overly significant as the Bollinger Bands remain mostly parallel. These parallel bands coincide with immediate resistance levels.