
If you want to make big money in the cryptocurrency world, it is enough to master the K-line.
Preface
If time could go back
Going back to the time when I first entered the trading market
I would like someone to remind me of the importance of the yin-yang line
Tell me this is the basis of the deal
Then I won't pursue a winning strategy
Waste time pursuing parameters of different technical indicators
This way I won't take so many detours.
Want to profit in the market
Especially the currency circle
You don't have to know some very advanced economic theories.
You may not know how to interpret the indicators behind each economic data
You can ignore all technical indicators
No need at all
But there is one thing you must understand thoroughly
This thing is the Yin-Yang line (K line)
If you are just starting to trade
You may find the yin-yang line complicated.
I totally don't understand what's going on.
But don't worry
This matter is not as complicated as imagined
I will use a very simple and clear method in this article
Take you step by step to understand this matter from shallow to deep
If you like this article, please give me a like at the bottom.
Your support is my motivation!

In a chart
Nothing is more important than price
The Yin-Yang line uses an image method
Shows the fluctuation of price within a certain period of time
The outcome of the battle between bulls and bears
How the market thinks about direction
Which party has control, etc.
All of the above things can be found through the Yin-Yang line to find some clues
Yin-Yang Line is the threshold to technical analysis
If we understand the meaning behind each yin-yang line
No matter what type of technical analysis you personally prefer
You can get twice the result with half the effort
Next Steps
I will lead you to interpret the Yin-Yang line in three levels (three levels)
First, I will break down the Yin-Yang line into 4 parts.
To interpret its surface information
Then I will summarize the Yin-Yang lines into 5 different levels of strength
To interpret the hints behind the Yin-Yang line
Finally, I will introduce you to the 4 most common yin-yang line patterns.
How to define them,
What they mean and how to use them
After reading this, you will understand
How to use the Yin-Yang line to find a lot of information that can help you analyze the market
You will also understand
Why do I say that Yin-Yang lines are the foundation of market profits?
Let’s get started!
Beginner's guide 1
We start from the first grade: [Beginner's guide]
Here I will teach you how to interpret the information that a yin-yang line brings to us on the surface.
When disassembling a yin-yang line
It can be divided into 4 key points
They are color, opening and closing high and low, body and shadow.

Before talking about the 4 key points, we must first know one thing
Each yin-yang line represents the fluctuation of price within a certain period of time.
If you use a one-minute chart
Each yin-yang line records the price fluctuation within this minute.
If you are using a daily chart
Each yin-yang line records the price fluctuation in the past 24 hours.
Color is our way of distinguishing whether this Yin-Yang line is a Yang line or a Yin line
Generally speaking, red represents a negative line.
Green represents Yang line
A positive candlestick means that the closing price is higher than the opening price within a certain period of time.
The opposite is true for the Yin line
When the Yin line ends
The closing price is lower than the opening price
So we can know one thing through the color of the yin-yang line
Is the temporary control of the market in the hands of buyers or sellers?
Next is the opening and closing high and low
I believe you have mastered these basic knowledge.
This is a simple matter

We use Yinxian and Yangxian as examples respectively.
The Yang lines from top to bottom are open high, close high, open low
Just like what I said before
His closing price is above his opening price
The Yin lines from top to bottom are high opening and low closing
The opposite of Yang line
Its closing price is lower than its opening price
Next, let’s talk about the physical line
The real body means the actual movement range of the price in a certain period of time.
Take the Yin-Yang line of a daily chart as an example
For example, its opening price this morning is 10 yuan
After a day of repeated transactions
No matter if he has risen by 15 yuan
Or maybe it once dropped to 7 dollars.
This position will only record the price at the moment when the Yin-Yang line ends.
It's what it costs
Finally, the shadow line
The shadows represent the high and low prices that the price has reached
A lot of important information can be seen from the shadows
I personally think that shadow lines are a very important part of interpreting the market.
I'll keep it a secret here for now.
In the last part I will use the candlestick patterns (K-line patterns)
Explain it to you in more detail
The Secret Behind Yin and Yang 2
OK
Congratulations on completing the first level [Beginner's Guide] course
Next Steps
Let's start to dig a little deeper
If we use watching a movie as an analogy
When you finish watching a play
You know how the story develops.
After the message the movie gives you on the surface
Would you like to think about this movie further?
It wants to convey a deeper meaning and message
Do you have some insights and personal interpretations?

If we apply this concept to the market
Each candlestick represents a story
This story has both long and short parts
The shortest one can be less than one minute
The longest one can be more than one month
What time chart are you using?
Every story has a beginning, a middle and an end.
On the surface, the yin and yang lines of this daily chart tell you:
My opening price was 10 yuan, and within 24 hours, the highest price reached 18 yuan. The lowest price was 7 yuan, and my closing price was 13 yuan.
These are the plots of a story.
If we interpret and reflect on this story more deeply
You will find many surprises
And these findings can effectively help you interpret the market
Next we are about to enter the second grade [The Secret Behind the Yin-Yang Line]
I will use several examples in order of intensity.
Explain to you in more detail
The secrets behind different types of yin-yang lines
Here I will summarize the Yin-Yang lines into 5 levels of strength.

The first
The entity is very long
And there is almost no shadow line
It is the most powerful yin and yang form.
Entity represents one party with almost complete control
Take this Yang line as an example
Buyer is interested
And has the ability to push prices up within a certain period of time
on the other hand
The shadow part is almost invisible
Represents the absence or opposite force is very weak
We see that the upward or downward forces are almost unimpeded.
It means that most market participants agree that the price is going in this direction.

The second
We see that this type of Yin-Yang line has a very long shadow
It used to be a big positive or negative line.
But I have been under strong pressure from the opposite direction.
The defending side showed great determination and strength
Finally, they successfully recovered the lost land
You still have control when the Yin-Yang line ends
Although its body is relatively short
But if we think deeper,
You will understand
The distance it travels is actually not shorter than the first type of yin-yang line.
This type of line is called a shooting star or hammer line.
We will look at some examples of charts in a moment.

OK
The third yin-yang line
This type of Yin-Yang line entity is actually not short
But there is one place that will greatly reduce our impression of it
This place is the shadow line
Let’s take the Yang line as an example
The price once surged to a high point
But it encountered the opposite force.
We saw
This Yang line has a shadow at the top.
The shadow represents rejection
That is, the seller regains some of the lost ground.
Compared with the first two kinds of reluctance
We see hesitation and reservation here
The fourth
This type of yin and yang line
It is not only physically short
And each has a long lead on the top and bottom
It represents that both sides have launched offensives.
But both sides refused to give in.
Neither side has the power to break this dilemma to a great extent.
The only way we can tell by color is that the buyer or seller still has a small amount of control
You may think that this type of K-line is very similar to the second one.
But because they end up in different places
So the whole meaning is completely different
Another major reason is that the shadows prove that the market has no clear direction for the time being.
We call this kind of yin-yang line a cross star
It could be a pause in the trend
Or the market is gathering strength to turn around.
Generally speaking, when the market is in a directionless situation
We shouldn't be in.

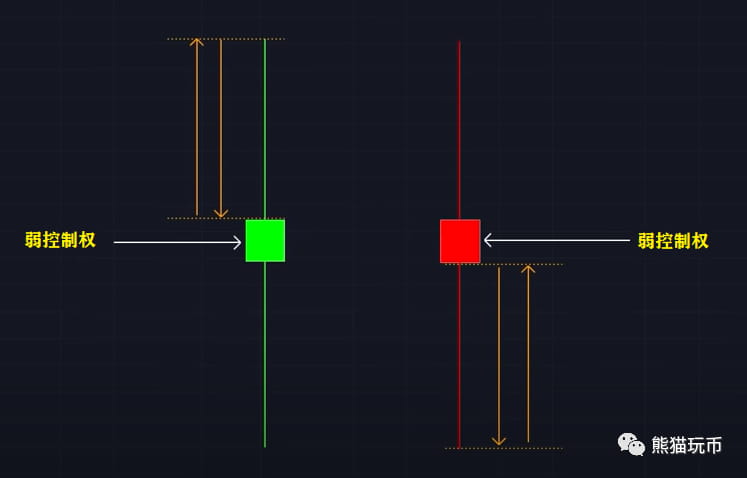
The fifth
Next is the weakest yin-yang line.
We have seen buyers or sellers attack upwards or downwards respectively.
Encountering strong resistance and rejection
Ended in failure
Once seemed to own the whole world
But unfortunately, the opponent counterattacked
And they are losing ground
At the end of the Yin-Yang line
I can only guard my last remaining territory.
The situation is quite dangerous
If you are trading with the trend at this time
That's a good thing to be careful about.
K-line pattern 3
OK
See here
I believe you already have a good understanding of the Yin-Yang line.
We finally come to the most important part
That is the third level [K-line pattern]
We have talked about the four parts that make up a yin-yang line.
And the meanings behind the 5 different types of strength Yin-Yang lines
Next, based on what we have just learned
Learn something quantifiable
Yin-Yang line patterns that can actually be used for trading
I will teach you the 4 most common Yin-Yang line patterns (K-line patterns) here
I will explain their definitions with diagram examples.
Formation principle and application method

they are, respectively
Hammer
Bullish Engulfing
Shooting Star
Bearish Engulfing

Hammer
Let’s start with the Hammer.
The hammer line is composed of a single Yin-Yang line.
There are three conditions
There is a very small or almost no upper shadow line.
The minimum length of the lower shadow should be 2~3 times the length of the body
The price must end above 25% of the entire Yin-Yang line
This form means:
When the Yin-Yang line begins
The sellers launched an offensive and moved downward for some distance
Then the buyers strike back
Even more powerful buyers
Until the Yin-Yang line is completely finished
Buyers successfully recovered most of their lost ground
And seized control
This form is a very favorable proof
Buyers begin to participate in the market
This is a favorable Yin-Yang line pattern.
Generally used for trend continuation and reversal
Here is a fallacy:
Many online tutorials say this is just a turning pattern.
Their description is a little bit incorrect.
Let's look at the following two examples

Example 1: Trend continuation
When we see an upward trend
Then a hammer pattern appeared during the pullback.
If we use price to define a trend in this example
This is higher.
This is relatively low.
We see an inverted hammer at a relative low.
Then we can expect the trend to continue
Make a new higher point

Example 2: Trend reversal
When a downward trend reaches a certain level
An inverted hammer pattern appears
Suggesting that buyer power is beginning to emerge and take control
Price starts a new trend
2. Bullish Engulfing

The second example is a bullish engulfing
The bullish engulfing candlestick pattern is a positive candlestick pattern consisting of two candlesticks.
We use three conditions to define
Does a bullish engulfing candle work?
They are
First: This pattern must be a Yin line followed by a Yang line
Second: The Yang line's body must completely cover the previous Yin line's body
The shadow line can be ignored here
Third: The entity of the Yang line cannot be smaller than the entity of the Yin line
We define the candlestick with a small body as a cross star
Instead of bullish engulfing
This pattern means that when the price falls to a certain position
A stronger force in the opposite direction emerges
In addition to gaining control
The closing price is higher than the previous opening price
Proof that market sentiment has changed
This is a favorable Yin-Yang line pattern.
The same applies to trend continuation and reversal situations.
Let's look at the following two application examples

Example 1
Trend continuation scenario
When we see an upward trend
Then a bullish engulfing pattern appeared at the pullback position
This is a good sign
Proves that the short-term reverse pullback has ended
The buyer officially returns to take back the home court
Prices continue to rise

Example 2: Trend reversal
In a downward trend to a certain extent
A bullish breakout pattern is emerging
Buyers find an opportunity to enter the market
Even more powerful than the seller
Reversing the price

Shooting Star
Next, let's learn two bearish K-line patterns.
The shooting star is actually the same as the hammer line just now.
It's just a change of direction.
The Shooting Star is a bearish pattern formed by a single candlestick.
An effective shooting star
There are also three conditions
There is a very small or almost no lower shadow.
The upper shadow is at least 2~3 times the length of the body
The price must end below 25% of the entire candlestick.
The name of the shooting star pattern
In fact, it has reflected its meaning
Shooting arrows into the sky
I've been to a very high point.
Stop when exhausted
Slowly falling back
Forming a long shadow
This pattern also applies to trend continuation and reversal situations.
You can refer to the example of the hammer line just now.
Turn all the shapes around and apply them to the shooting star.
I won’t repeat the examples here.
but
I want to talk about another popular usage
It is a combination of shooting star and moving average.

I use a 200 EMA as an example
The moving average is actually the balance point of the market
The most fatal mistake most of us make with moving averages
It is to make trading signals such as golden cross and dead cross
Because the price and balance point are completely ignored
That is to say, the interaction between moving averages
The correct usage of EMA should be like this
When the price is close to the EMA
Tried to push upwards
We know that the moving average is actually a dynamic support and pressure level.
In disguise
That is, the price tells you through a shooting star:
I once wanted to break this average line and change the long-term trend, but failed, and I no longer have the energy to continue upward.
So the price returns to its original trend
Continue down

Bearish Engulfing
The last example is a bearish engulfing.
The Bearish Engulfing is a bearish candlestick pattern consisting of two candlesticks.
I will also use three conditions to define
First: This pattern must be a positive line followed by a negative line
Second: The entity of this Yin line must completely cover the entity of the previous Yang line
Third: The entity cannot be too small
This pattern means that after the price rises to a certain position
Suddenly, a stronger force in the opposite direction appeared.
It's like a car emergency brake
Turn around and leave immediately
This pattern also applies to trend continuation and reversal examples.
Just like the bullish engulfing
Turn it upside down.
I won't repeat it here.
I will use major support and resistance levels in conjunction with the bearish engulfing
Make a trading example
If you don’t know what the main support and resistance levels are
Don't know how to identify and find the main support and resistance levels
Check out my previous articles

We see here
This is a major support and resistance level
I won't explain it in detail.
But at this position, combined with bearish engulfing and other K-line patterns
Its winning rate is very high
We see that the price goes to the main support and resistance level
The next entity immediately appears with a force in the opposite direction
And this force is more powerful than the seller
Finally, a bearish engulfing pattern was formed.
It fully meets the conditions for us to define this form as valid.
After a positive line
Then a negative line
The body of the negative line
Completely covers the body of the Yang candlestick
And the entities also have sufficient length
Prove its determination to change the trend
Prices should go down
Conclusion
So about the K-line course
That’s all we have to say today
I received a message from a fan two days ago.
Say it's too long
Can't digest it all at once
So I will try to control the length in the future
Try not to make everyone feel that learning is a very stressful thing
but!
I said
The trading market is the fastest way to monetize technology
As long as you learn the technology
You can cash in immediately
No marketing required
No need to rent a house
No need to purchase
No activities required
No need to recruit
......
You don't even need to buy a computer.
You can make a fortune quietly
The kind with no upper limit
But making money has never been easy
If you only learn half a barrel of oil
I hurried in
That would be a loss of both the wife and the army.
Trading is not gambling!
Thank you for your continued attention
See you next time!