
🚀 BTCUSDT Technical Analysis Chart: A Bull Flag Formation Indicates Potential Upside Move 📈

🔍 Technical Analysis: $BTC
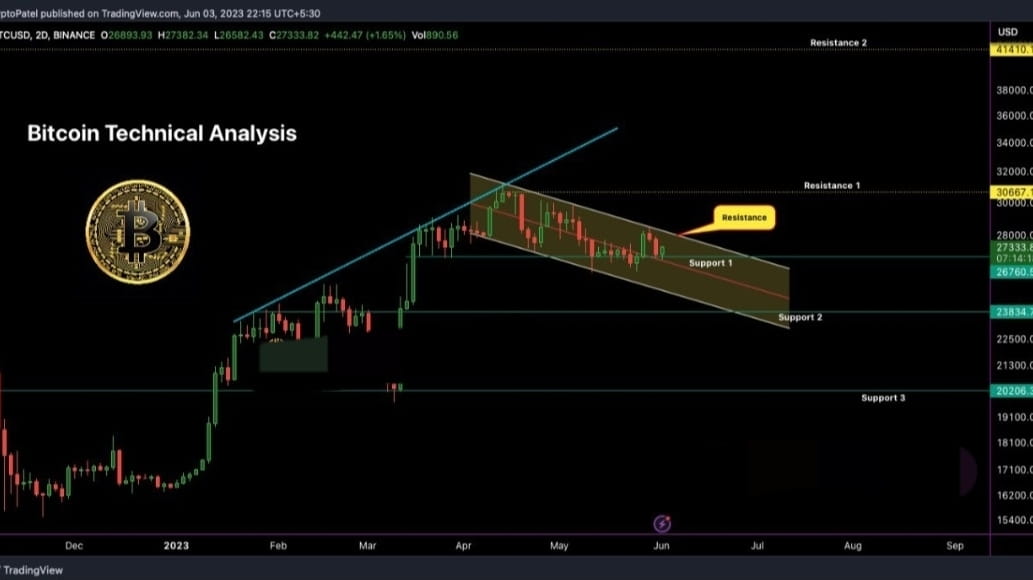
💰 Current Price: $27,300
📈 Chart Analysis: A bull flag pattern is forming on the higher time frame (HTF) chart for BTCUSDT, suggesting the possibility of a significant upward move in the near future.
✅ Key Takeaways:
Upper side resistance level to watch for breakout: $28,300
Critical support levels: $26,700, $23,800, and a potential buying opportunity at $20,000
Upside target upon breakout: $41,400
Resistance levels to monitor: $30,700 and $41,490
🔮 Analysis: BTC is currently trading below the trendline resistance, which also serves as the upper side resistance of the bull flag pattern. However, a breakout above $28,300 with a candle close above this level could ignite a bullish rally, potentially leading to a target of $41,400.
💡 Conclusion:
Based on the technical analysis, the bull flag formation indicates a possible upward move for BTCUSDT. Traders should closely monitor the breakout above $28,300, while being aware of support levels at $26,700 and $23,800. It is important to conduct thorough research and analysis before making any investment decisions.
⚠️ Disclaimer: This analysis represents a personal view and should not be considered as financial advice. Always do your own research before investing in any cryptocurrency.