
Introduction
Chart patterns are abundant when it comes to technical analysis. We've already talked about them in our Beginner's Guide to Classic Charting Patterns and 12 Popular Candlestick Patterns Used in Technical Analysis. However, there are many other patterns that can be useful for day traders, swing traders and long-term investors. Golden cross and death cross are two such patterns.
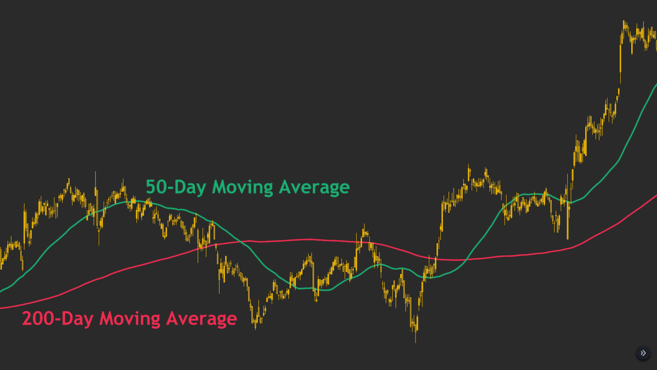
Before we talk about golden cross and death cross, we need to understand what the moving average (MM) is. Basically, it is a line drawn on a price chart. It measures the average price of the asset over a certain period of time. For example, a 200-day moving average will measure the average price of the asset over the last 200 days. If you want to know more about moving averages, we have an article about them: What are Moving Averages?.
So, what are the golden cross and death cross patterns and how can traders use them in their trading strategies?
What is golden cross?
A golden cross (or golden crossover) is a chart pattern that involves a crossing of a short-term moving average above a long-term moving average. Typically, the 50-day moving average (MA) is used as the short-term average and the 200-day MA is used as the long-term average. However, this is not the only way to interpret a golden crossover cross. This can happen over any period of time. The idea is that a short-term average crosses a long-term average on the graph.
Typically, a golden cross happens in three phases:
The short-term MA is below the long-term MA during a downtrend.
The trend reverses and the short-term MA crosses above the long-term MA.
An uptrend begins, where the short-term MA remains above the long-term MA.

A golden cross indicating a new uptrend for Bitcoin.
In many cases, a golden cross can be considered a bullish signal. Why? The idea is simple. We know that the moving average measures the average price of an asset over a certain period. Therefore, when the short-term MA is below the long-term MA, it means that the short-term price action is bearish when compared to the long-term price action.
Now, what happens when the short-term average exceeds the long-term average? The short-term average price is higher than the long-term average price. This indicates a potential change in the direction of the market trend. This is why a golden cross is considered a bullish sign.
In the conventional interpretation, the Golden Cross is the crossover of the 50-day MA above the 200-day MA. However, the general idea behind the golden cross is that a short-term moving average crosses over a long-term moving average. In other words, we can also have golden cross signals occurring at other time intervals (15 minutes, 1 hour, 4 hours, etc.). Still, signals from longer time frames tend to be more reliable than signals from smaller time frames.
So far, we have evaluated the golden cross with what we call simple moving averages (SMA). However, there is another popular way to calculate a moving average, called an exponential moving average (EMA). It uses a different formula that places a greater emphasis on the most recent price action.
EMAs can also be used to look for bullish and bearish crossovers, including the occurrence of the golden cross. Because EMAs react more quickly to recent price movements, the crossover signals they produce can be less reliable. Even so, EMA crossovers are widely used as a tool for identifying trend reversals.
What is Death Cross?
Death cross is basically the opposite of golden cross. It is a chart pattern where a short-term MA crosses below a long-term MA. For example, the 50-day MA crosses below the 200-day MA. Therefore, a death cross is generally considered a bearish signal.
Typically, a death cross happens in three phases:
The short-term MA is above the long-term MA during an uptrend.
The trend reverses and the short-term MA crosses below the long-term MA.
A downtrend begins, where the short-term MA remains below the long-term MA.

A death cross confirming a downtrend for Bitcoin.
Now that we understand what a golden cross is, it is quite easy to understand why the death cross represents a bearish signal. The short-term average crosses below the long-term average, which indicates a bearish outlook on the market.
The death cross pattern has provided bearish signals before major economic crises in history, such as those of 1929 or 2008. However, it can also provide false signals, as occurred in 2016.
False SPX death cross signal in 2016.
As we can see in the example, a death cross occurred and, shortly after, the market resumed its upward trend, resulting in a golden cross.
Golden cross vs. death cross - what's the difference?
We have already discussed both patterns, so the difference between them is not difficult to understand. They are essentially opposite patterns. The golden cross is considered a bullish signal and the death cross is considered a bearish signal.
Both can be confirmed by the high trading volume. Some technical analysts also use other technical indicators to analyze the crossover context. Some examples include the Moving Average Convergence Divergence (MACD) and the Relative Strength Index (RSI).
It is important to remember that moving averages are lagging indicators and have no predictive power. This means that both crossovers typically provide strong confirmation of a trend reversal that has already happened – not a reversal that is still in progress.
➟ Thinking about investing in cryptocurrencies? Buy Bitcoin on Binance!
How to trade using golden cross and death cross
The basic idea behind these patterns is quite straightforward. If you know how traders use the MACD, you will easily understand how to trade using these crossover signals.
When we talk about conventional golden cross and death cross, we usually look at the daily chart. Therefore, a simple strategy might be to buy at a golden cross and sell at a death cross. In fact, this would be a successful strategy for Bitcoin in recent years – although there were many false signals along the way. Therefore, blindly following a signal is usually not the best strategy. Therefore, we recommend that you consider other factors and techniques for market analysis.
If you want to learn an easy strategy for building a long-term position, check out the article on Dollar-Cost Averaging (DCA).
The crossover strategy mentioned above is based on daily moving average (MM) crossovers. What about other time periods? Golden cross and death cross patterns occur in the same way and traders look to gain advantages from them.
However, as with most chart analysis techniques, signals from longer time frames are stronger than signals from smaller time frames. A golden cross can occur in a weekly period, while we observe a death cross occurring in an hourly period. Therefore, it is always useful to zoom out and see the bigger picture on the graph, considering several possible interpretations.
Something that many traders consider when trading golden cross and death cross occurrences is trading volume. As with other chart patterns, volume can be a very important tool for confirming signals. When a spike in volume accompanies a crossover signal, many traders feel more confident about the signal's validity.
When a golden cross occurs, the long-term moving average can be considered as a potential area of support. On the other hand, when a death cross occurs, it can be considered as a potential area of resistance.
Crossover signals can also be checked in conjunction with signals from other technical indicators to find confluence (when different indicators reproduce the same signal). Traders combine multiple signals and indicators into a trading strategy in an attempt to achieve confluence and produce more reliable trading signals.
Final considerations
We discuss some of the most popular crossing signs – golden cross and death cross.
A golden cross involves the crossing of a short-term moving average above a long-term moving average. A death cross is the crossing of a short-term MA below a long-term MA. Both can be used as reliable tools to confirm long-term trend reversals and are used in the stock, forex and cryptocurrency markets.


