
BTC market faces selling pressure, with short-term rebound potential. Bitcoin price analysis shows that BTC price is moving lower, breaking the key $28,000 level. If the bearish trend continues, BTC may fall below $26,000 in the short term.
Bitcoin Price Analysis Markets have fallen sharply over the past 24 hours, with optimistic rebound efforts frustrated after the $28,000 level was decisively broken. Bulls’ attempts to push the price higher were unsuccessful, resulting in a gradual slide to the current price of $27,440.
The BTC price was hovering around $28,000 the previous few days; however, today’s spike in selling pressure was too much for the market to handle. While the price is currently holding up at the $27,310 support level, there is a risk that the price will fall further if the bearish momentum continues. The BTC market is currently facing a huge amount of selling pressure, but there are some potential signs that a rebound could be in the near term.
Bitcoin Price Analysis on Daily Chart: Bitcoin Drops to Low of $27,440 Following Strong Sell-off
Daily Bitcoin price analysis shows that the price has dropped today due to renewed selling pressure. The price of the BTC/USD pair has fallen sharply in the previous few hours and is currently trading at $27,440, down 6.3%. The bears have managed to break above the important resistance level of $28,986, suggesting that the trend may be in their favor at the moment.
Traders are cautious and reluctant to buy Bitcoin due to the risk of future price declines, resulting in low market volumes. BTC’s market capitalization has also fallen sharply and currently stands at $533 billion.
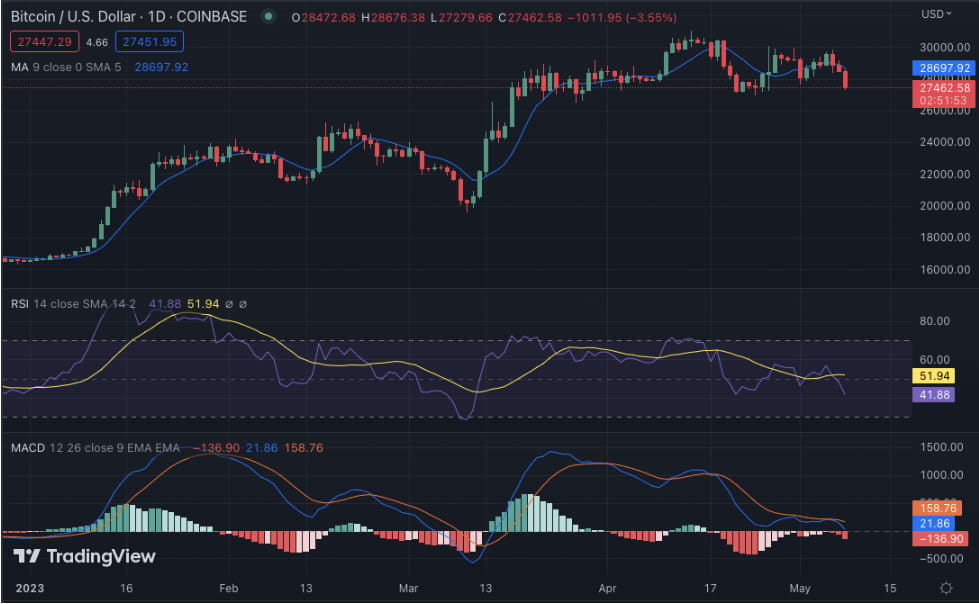
BTC price analysis on the 24-hour chart shows that the coin is currently in a bearish market sentiment. The decline in the market turned to bearish sentiment, as shown by the RSI line, which is located below the 50.00 level. The RSI indicator is currently trading at 41.88 and heading towards the oversold region, which is another sign that the price may fall further in the short term. The moving averages also suggest that the bearish trend is currently in control and if the bearish momentum intensifies, the price may test the $28,697 level.
Bitcoin Price Analysis 4-hour chart: BTC price continues to sink below $28,000
The latest Bitcoin price analysis on the 4-hour chart shows that the price continues to fall after the breakout. Bitcoin price analysis today shows that BTC is currently in a consolidation phase around the $27,440 mark. Previously, the currency lost value significantly this week as sellers pushed the price below key support levels.
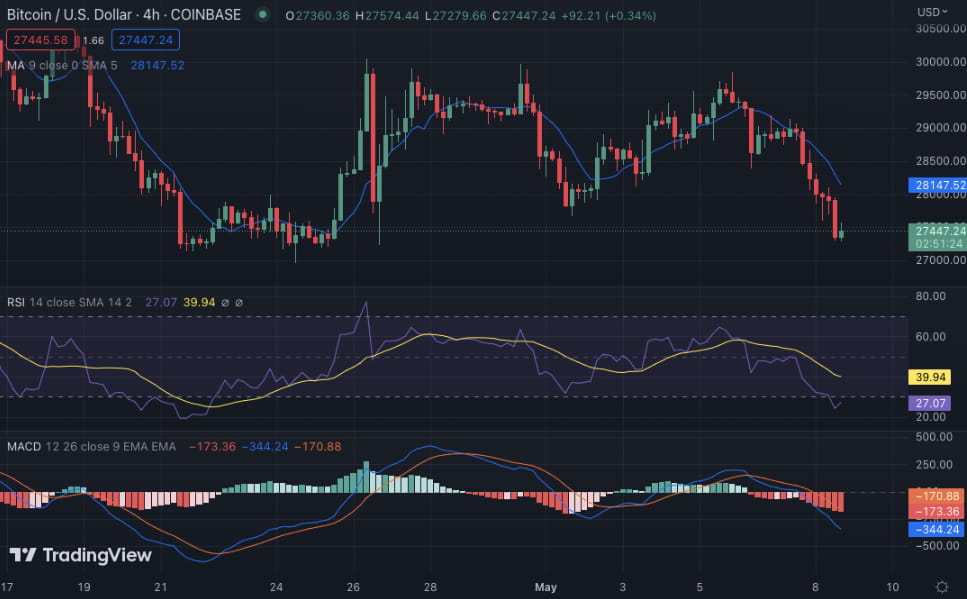
Technical indicators remain bearish, with the RSI currently trading at 27.07, suggesting that prices still have some room to move downward. On the other hand, the MACD is giving a bearish signal as the histogram is declining and about to cross below the zero line. The MACD line is clearly below the red signal line and appears to be gaining strength. The 200 SMA line is just below the current market price, suggesting that the path of least resistance is still to the downside.
Bitcoin Price Analysis Conclusion
All in all, Bitcoin price analysis suggests that there is a downside move in price following recent losses. However, if the currency can hold above key support levels, there could be hope for a price recovery in the near future.