

Key Points
Binance has just launched a brand new feature for candlestick charts.
Traders who are used to using charts can now use the 1-second interval feature to assist with technical analysis.
This feature is available on both spot and margin charts. Read on to learn how to use it.
Binance has just launched a new feature to monitor spreads by the second, as requested by traders. Learn how to use candlestick charts with 1-second intervals.
For centuries, traders have used candlestick charts to make smarter trading decisions. Traders can access candlestick charts through various technical tools on Binance for technical trading. This method aims to predict future market behavior by analyzing historical price behavior and volume data.
Binance has launched a new feature called 1-second intervals for candlestick charts. Traders who are used to using candlestick charts can now refine their analysis with price updates every second for spot and margin. The 1-second interval feature is available on both desktop and mobile, allowing traders to observe current price behavior in detail.
Please note that this feature is not currently available for contracts.
What is a candlestick chart?
Among the many technical charts that traders are accustomed to, the candlestick chart is the most widely used. The candlestick chart is a financial chart composed of candlestick patterns, and the candlestick pattern represents a fixed time frame. For example, if you select the daily candlestick (1 day) in the BTC/BUSD chart, each candlestick represents the daily price information of BTC against BUSD.
Each candlestick conveys the following information:
Opening Price: The first recorded trading price of an asset within a specific time frame.
Closing Price: The last recorded trading price of an asset within a specific time frame.
High Price: The highest trading price recorded for an asset within a specific time frame.
Lowest Price: The lowest trading price recorded for an asset within a specific time frame.
If you’re interested in learning more about technical trading, read our curated collection of technical analysis articles on Binance Academy.
How to use Binance's 1-second interval feature

On Binance official website:
Find the asset you’re interested in on the Binance Markets page.
Select a trading pair. The candlestick chart of the trading pair will be displayed.
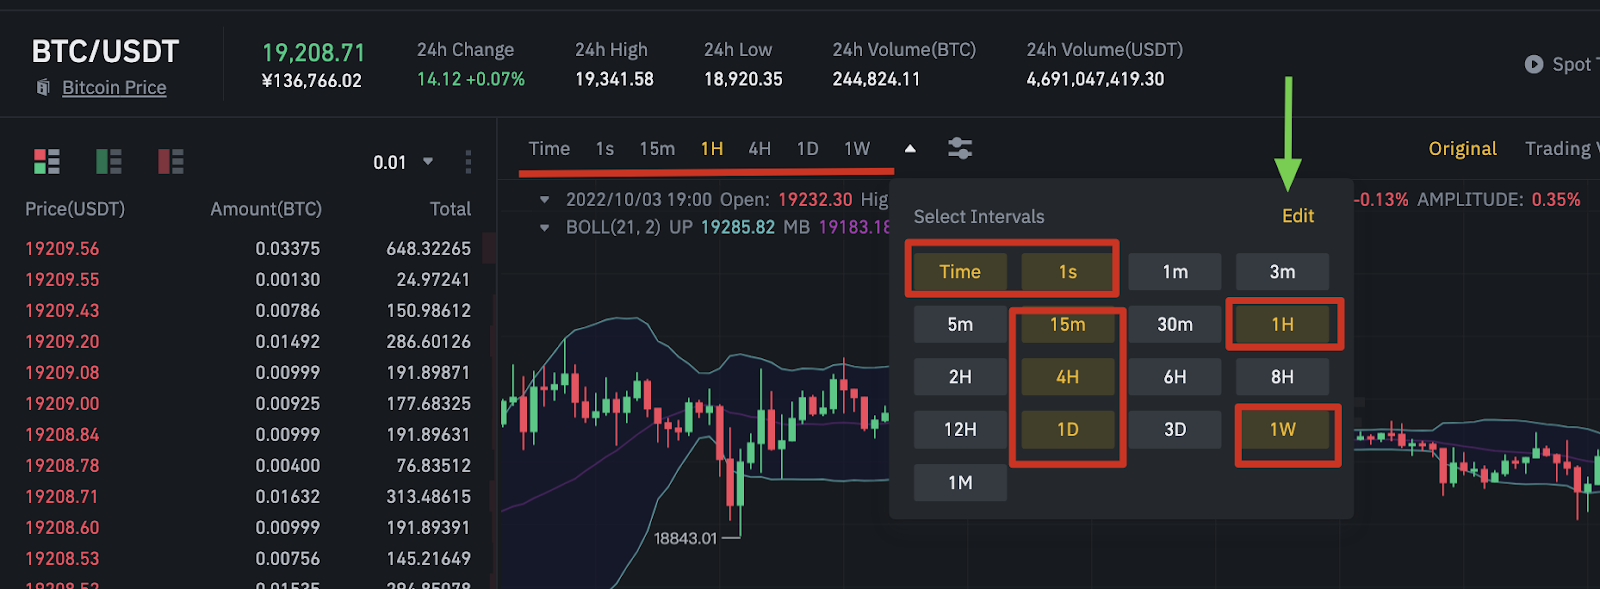
Click the "1 second" option just above the candlestick chart to change the candlestick chart time interval to 1 second.
On the Binance App:

Find an asset of interest.
Select a trading pair. The candlestick chart of the trading pair will be displayed.
Click the "1 second" option just above the candlestick chart. If this option is not displayed, click "Select preferred time interval" and click the "1 second" option. After confirming your selection, the "1 second" interval option can be selected.
In addition to the candlestick time intervals, traders can choose to customize the Binance chart layout.
Upgrade your technical analysis toolkit now!
Candlestick charts are one of the basic tools for traders and investors. Analyze price behavior in different time frames such as 1-second intervals to obtain a more comprehensive technical analysis method.