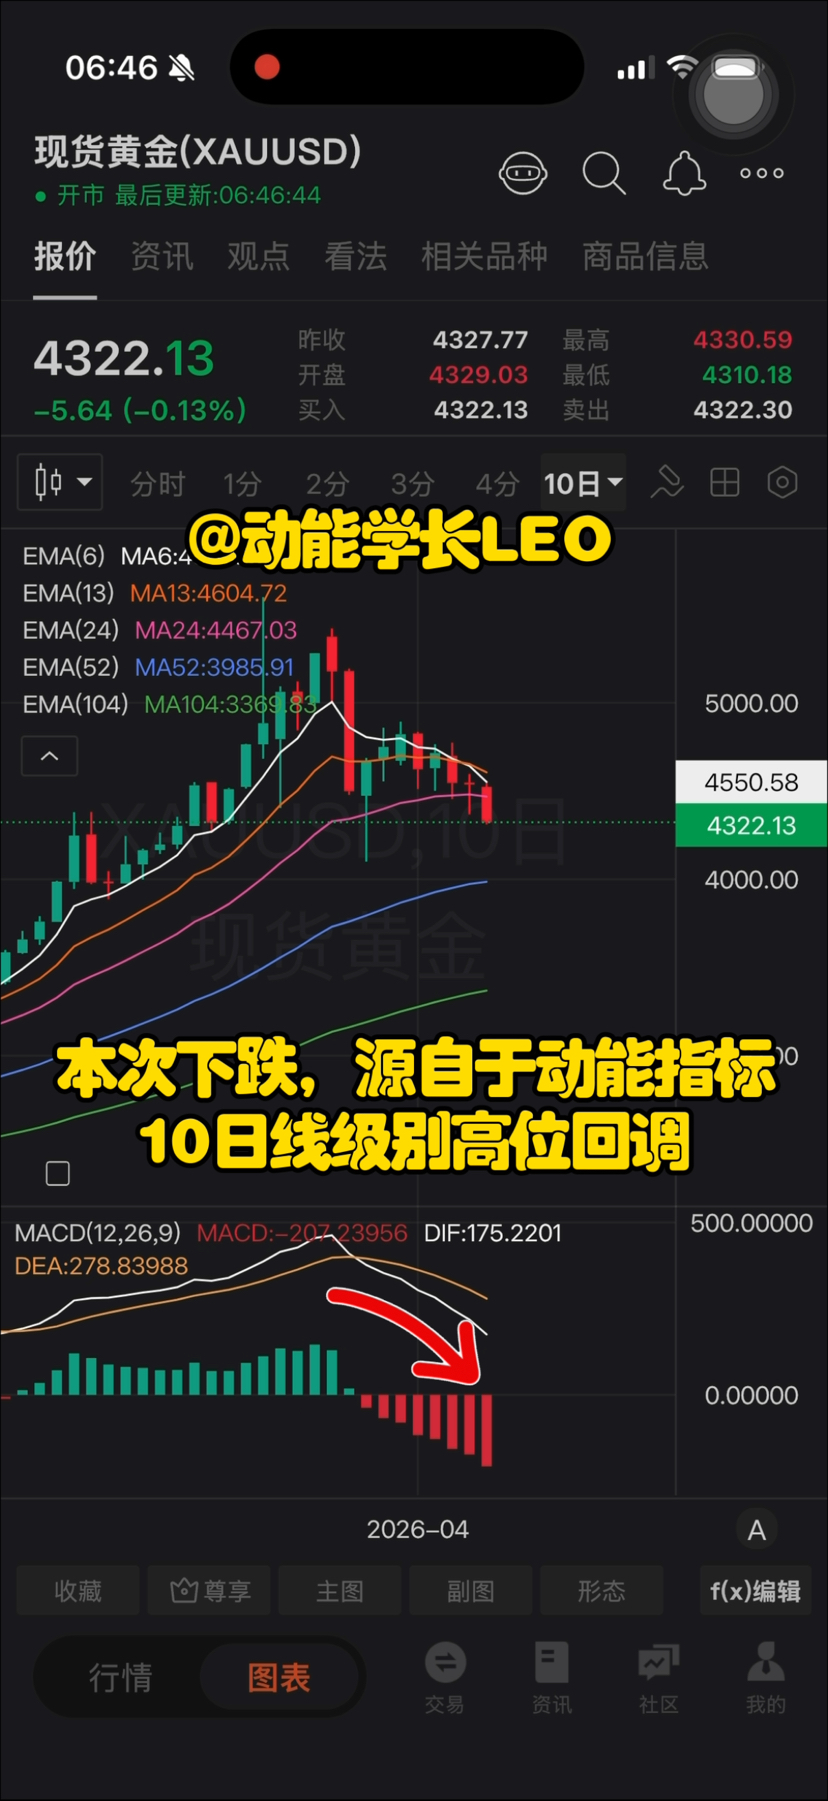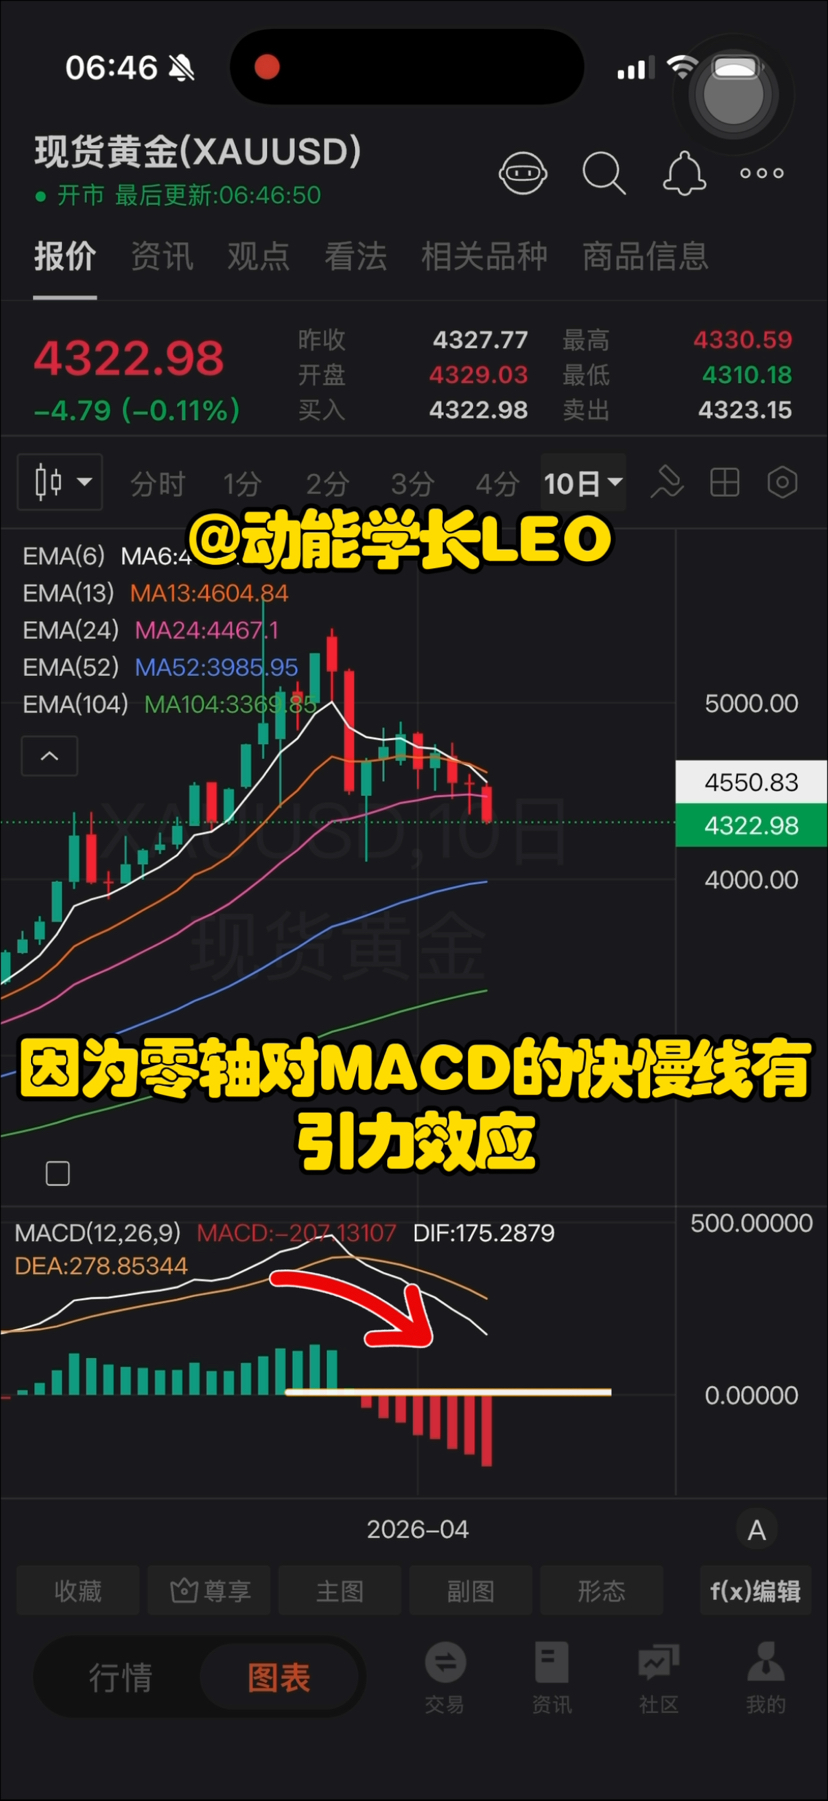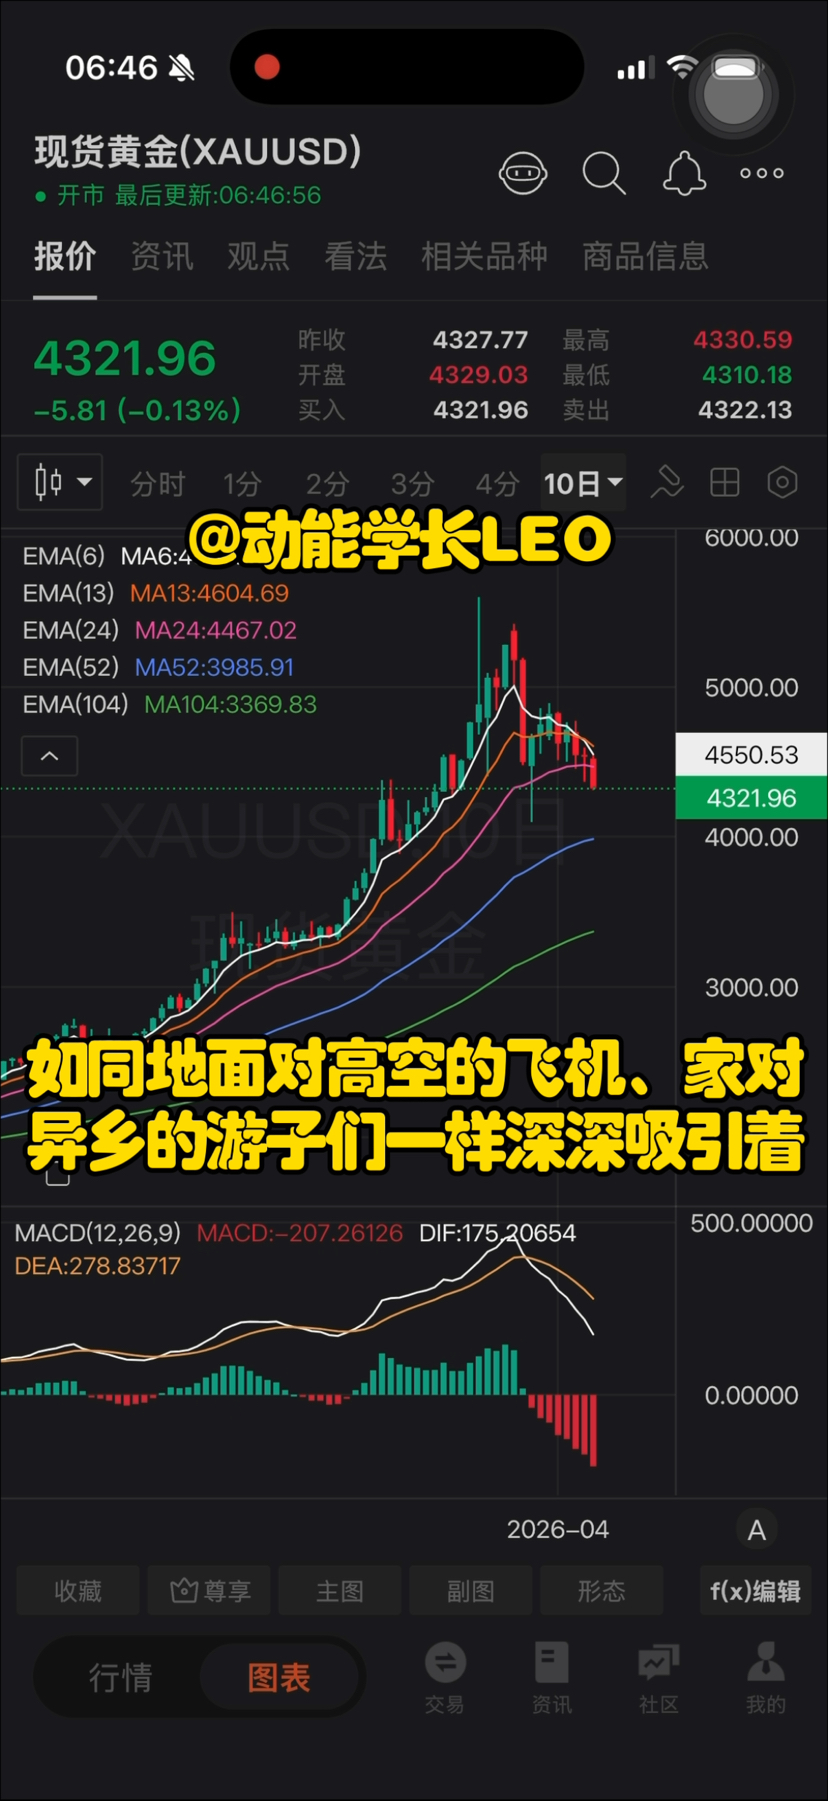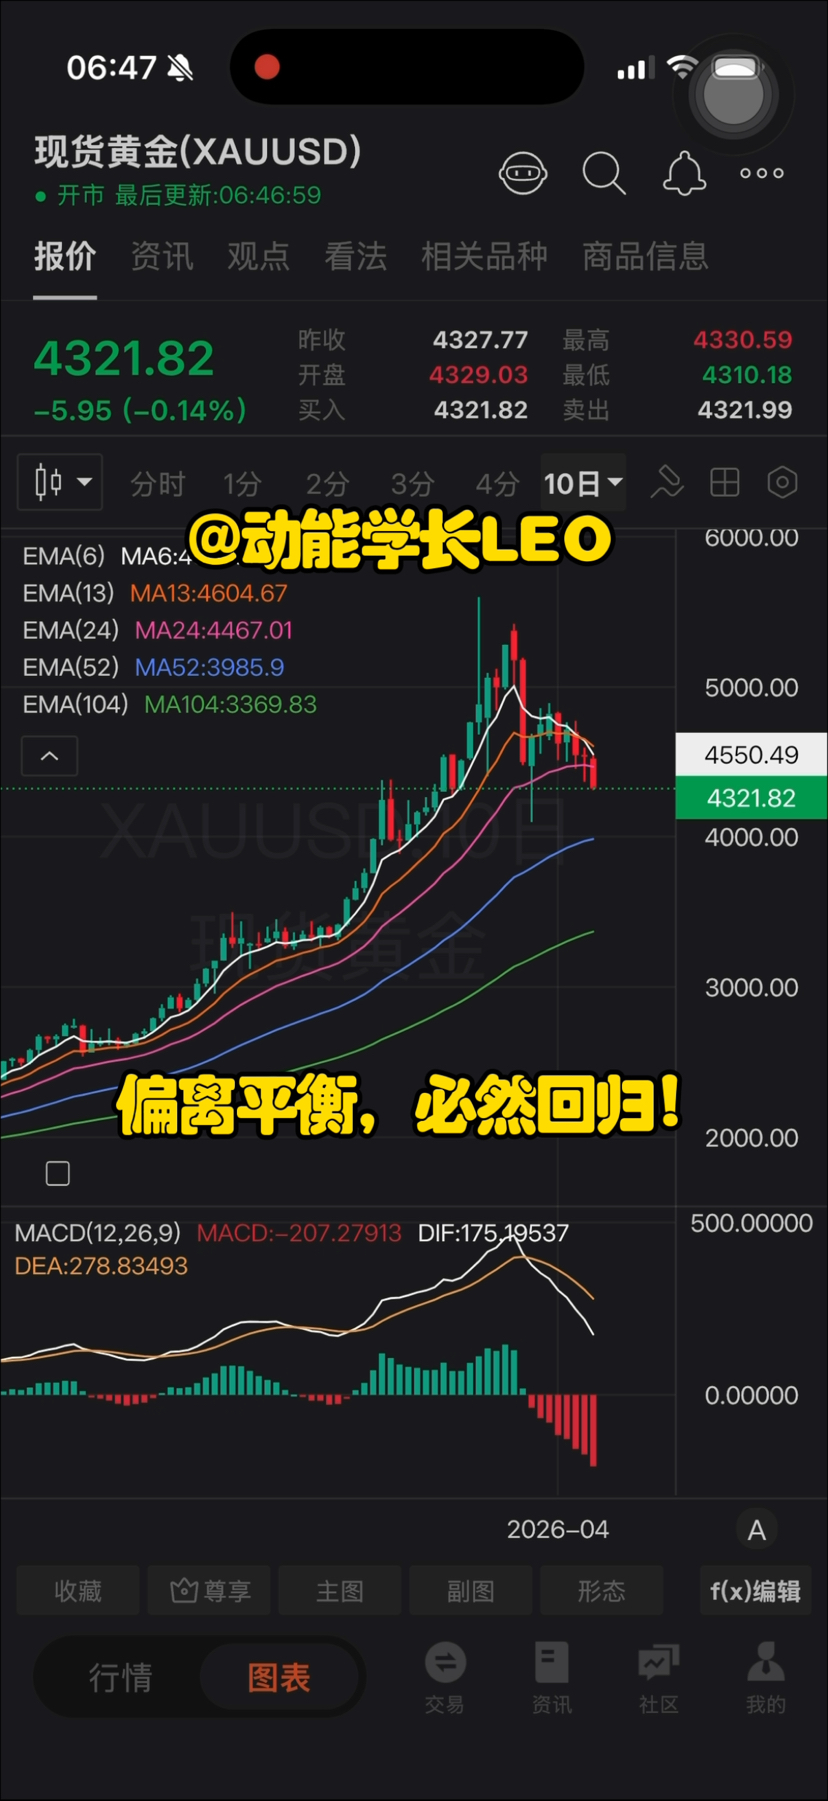

The operational logic of time cycles and the periodic changes in energy are the wealth codes behind the ups and downs of candlesticks. Since its inception, BTC has now entered the lifecycle at its 60-day moving average level, while XAU has been operating at its yearly moving average level since 2001. You can check the MACD indicators for these two timeframes to verify this. 🍁 The recent drop in XAU is due to a high-level pullback in the momentum indicator at the 10-day moving average! MACD is not just a cyclical indicator, but also an energy indicator—it's much more complex than just golden and death crosses. Follow me to learn more about MACD!
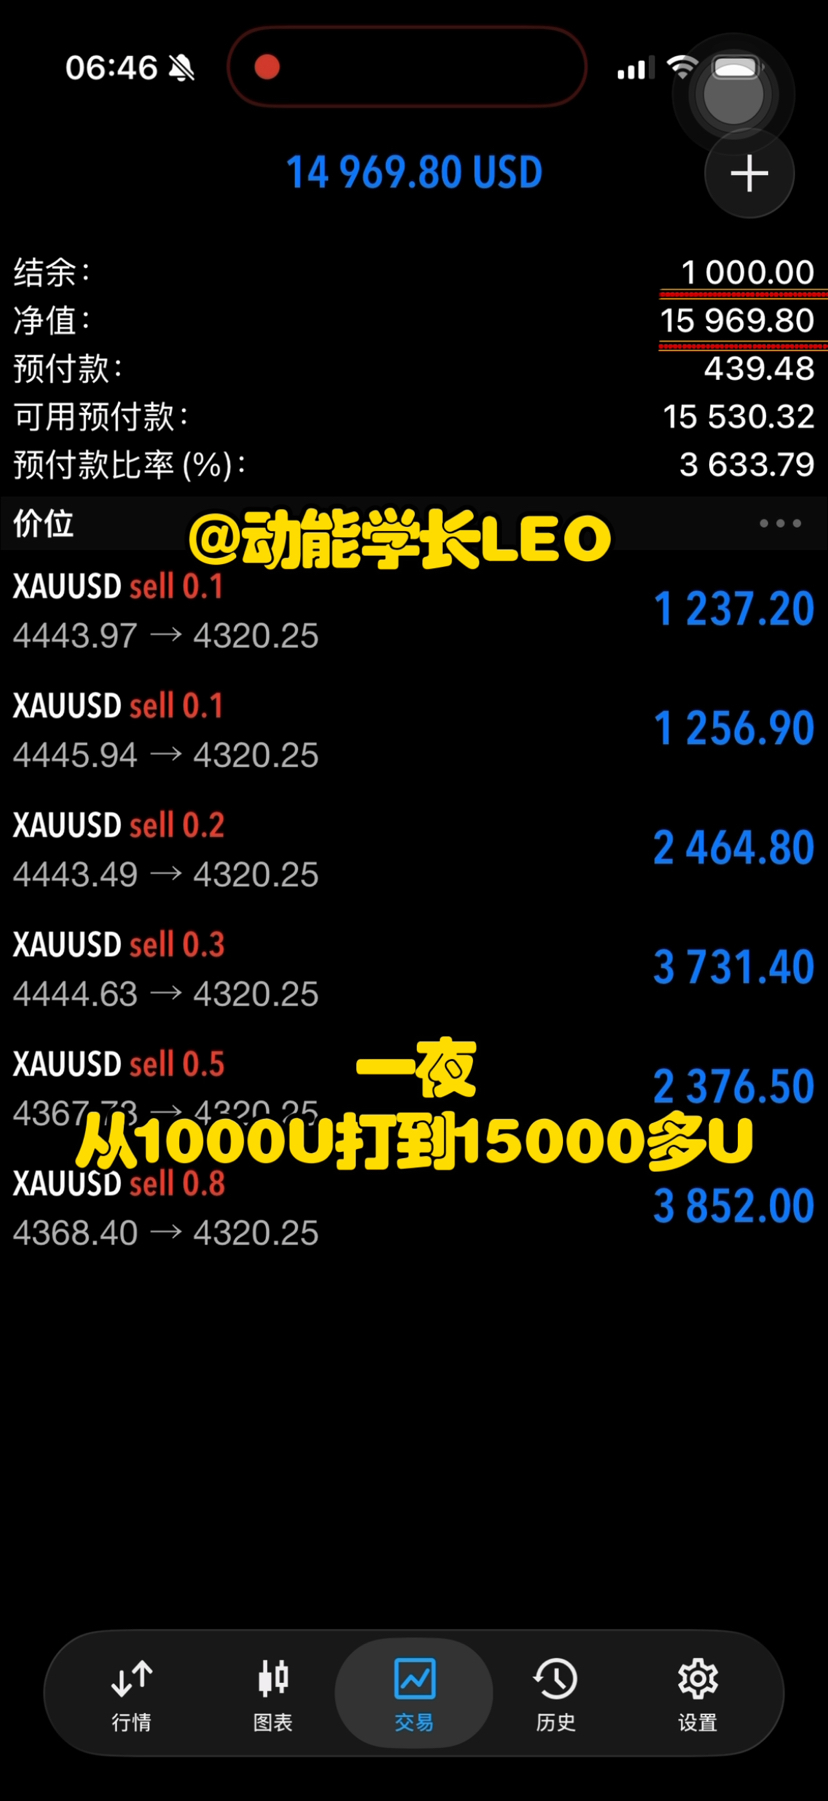
💰💵Utilizing candlestick momentum trading techniques, I flipped $1000 to $15000 overnight, scoring a 15x return.